Mapping the results of the 2022 Ontario Provincial Election

I just finished mapping out Doug Ford’s Progressive Conservative election win from 2022. On June 2 of that year, the voters of Ontario returned the PC leader with a majority government with 83 seats. The Progressive Conservatives defeated the Ontario Liberals led by Steven Del Duca and the Ontario NDP which was helmed by Andrea Horwath. Both defeated party leaders would move on from provincial politics and have since become the mayors of Vaughan and Hamilton, respectively.

The results of this pandemic-era election were very much similar to the 2018 provincial election – another majority for the PC under Ford – but the election saw a strenghthened mandate for the Premier. One independent candidate was elected in Haldimand–Norfolk.

This is the sixth election I’ve mapped out for the province of Ontario. You can review all of those elections here and drill down on the results of this one using the provincial map.

The mapped results of the 2022 Ontario Provincial election

Clicking/tapping on a riding will zoom you into the map for a poll-by-poll breakdown. You can dive into your own riding and find out how your neighbours voted! Hovering over ridings or neighbourhood polls will show a pie chart breakdown of the proportion of votes in a particular area. Expanding the tile at the bottom right and switching to the “Turnout” tab will show voter turnout rates on a riding level or can show poll-by-poll rates of partipation.

Scarborough Centre coloured by poll winner.

You can also use the search bar at the top of the page to search for any candidate or riding over the last 6 elections. Some candidates appear more than once and you can track their electoral history (no matter which riding they may have contested). Clicking on a riding will also show a “related content” button at the top of the page which you can use to find the results of nearby ridings. A few of those ridings are also summarized below the map.

Green party win in Guelph shaded by the strength of the Progressive Conservative vote (ironically the colour green showing strongest PC areas here). Mike Schreiner, the Green Party leader won the party’s only seat.

If you’re wondering how to take these screenshots to put these images in your own posts or tweets, click the camera at the top left of the map. This will download an image of the map.

Zooming around the map is a lot of fun. It’s vector-based, so zooming in and out is smooth and looks great.

Clicking the “Up to 2022 Provincial Election” button in the top right zooms the map out to the provincial riding context, while clicking on a riding zooms in to show the local breakdown.

A particularly strong neighbourhood poll for PC candidate Doug Ford in Etobicoke North.

I’ve integrated building footprints for all of Ontario (and Canada) into my map, so you can see grouping of houses on cul-de-sacs, apartment buildings, and in some cases even the house numbers.

NDP leader Andrea Horwath best poll in Hamilton Centre.

Visualizing these building footprints in neighbourhoods for various polls is a new feature of this iteration of these maps. I’ve also extended this feature to my previous maps (both federal and provincial). It can be useful to consider different zoning and dwelling types when appreciating party strength in a riding.

Liberal leader Steven Del Duca did not have a great showing in his riding of Vaughan–Woodbridge.

I enjoy pulling these maps together for the broader political community and to help voters further engage with our democratic process. I’ll be mapping other provincial elections as that data becomes available from the relevant provincial elections agencies.

York South–Weston showing a diversity of voting preferences throughout the riding.

Mapping the results of the 2019 Alberta provincial election

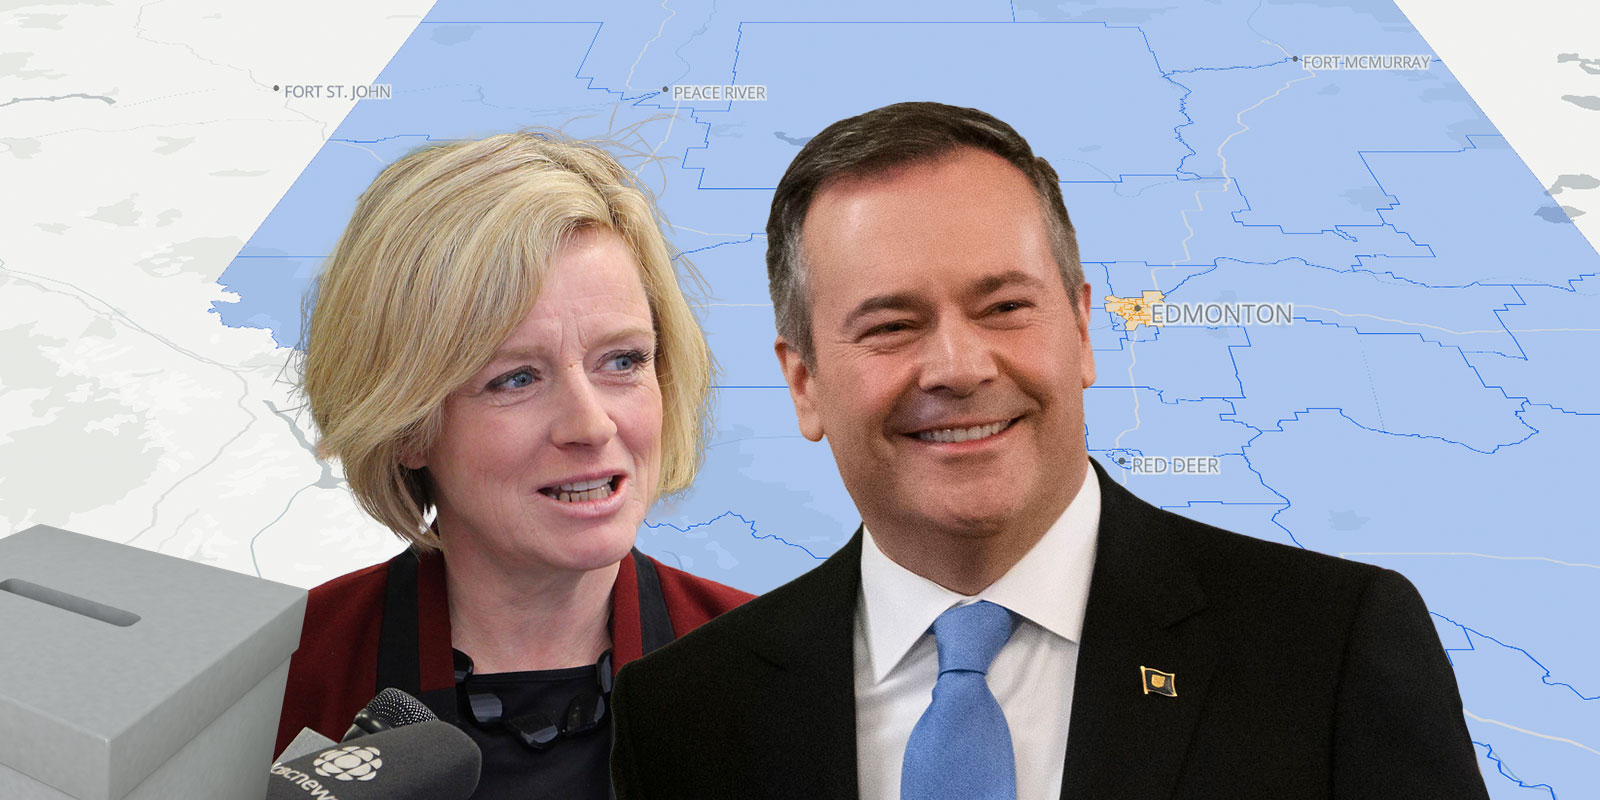
Map release day is always a good day. I’ve been griding away putting together a provincial map of the 2019 Alberta provincial election results. In this election, the newly formed United Conservative Party won a majority government under the leadership of Jason Kenney, defeating incumbent Premier Rachel Notley and the NDP.

The 2019 Alberta provincial election results map with a preview of the vote distribution of Fort Mcmurray-Lac La Biche

You can browse the provincial result riding by riding and click/tap each riding to zoom in and view the results poll-by-poll at a level which describes how different neighbourhoods in Calgary and Edmonton (for example) voted in this election.

The Edmonton-Riverview results map shows an NDP win, but colouring the map on strength (green) and weakness (red) of the United Conservative Party reveals which neighbourhoods where the party that would win the election turned out their vote

Expanding the “poll winner” control will allow you to colour code the riding polls by the strength of each party which contested the riding. Even the relative strength of parties and candidates with little hope can be discerned with ease.

The Calgary-Buffalo map shows the polls where the NDP and UCP battled for downtown Calgary. Expanding the tooltip at the bottom right allows us to see voter turnout poll-by-poll

A helpful tooltip that shows a pie chart of each riding – and at the poll level, each poll – can be expanded to list the candidates and voter turnout for each part of the province.

You may also find it useful to search for ridings by name or by candidate using the search bar at the top of the maps page. Each riding also shows adjacent ridings at the bottom of the page which makes it easy to browse other contests nearby.

A close up of the Edmonton-Gold Bar results map shows houses and apartment buildings. Get a street-level view of the results of the 2019 Alberta provincial election!

The unification of the Progressive Conservative party and the Wildrose certainly changed the political map if you compare the results to 2015 and to 2012. In 2019, a sea of blue with one island of orange in Edmonton with a peppering of orange in Calgary and Lethbridge is the sum of the 2019 map.

The 2015 Alberta provincial election results map shows the NDP defeat of the Progressive Conservative party with the Wildrose in Official Opposition

The 2012 Alberta provincial election results map shows the contest between Alison Redford‘s PCs and Danielle Smith‘s Wildrose party.

So, do take a look! The United Conservative Party’s leadership race is underway after the resignation of Jason Kenney as party leader. How will the party fare against the NDP in the upcoming 2023 Provincial election? Party strategists may find these maps helpful to understand the historical context of politics in each region of Alberta and how the vote has evolved over the past decade.

On a technical note, I switched the maps over from raster to vector format meaning they should look smooth at any magnification. I hope to talk more about that in a later post. As a fun side-effect, you can also tilt the maps!

Downtown Calgary looking south showing UCP areas of UCP strength