Mapping the results of the 2022 Ontario Provincial Election

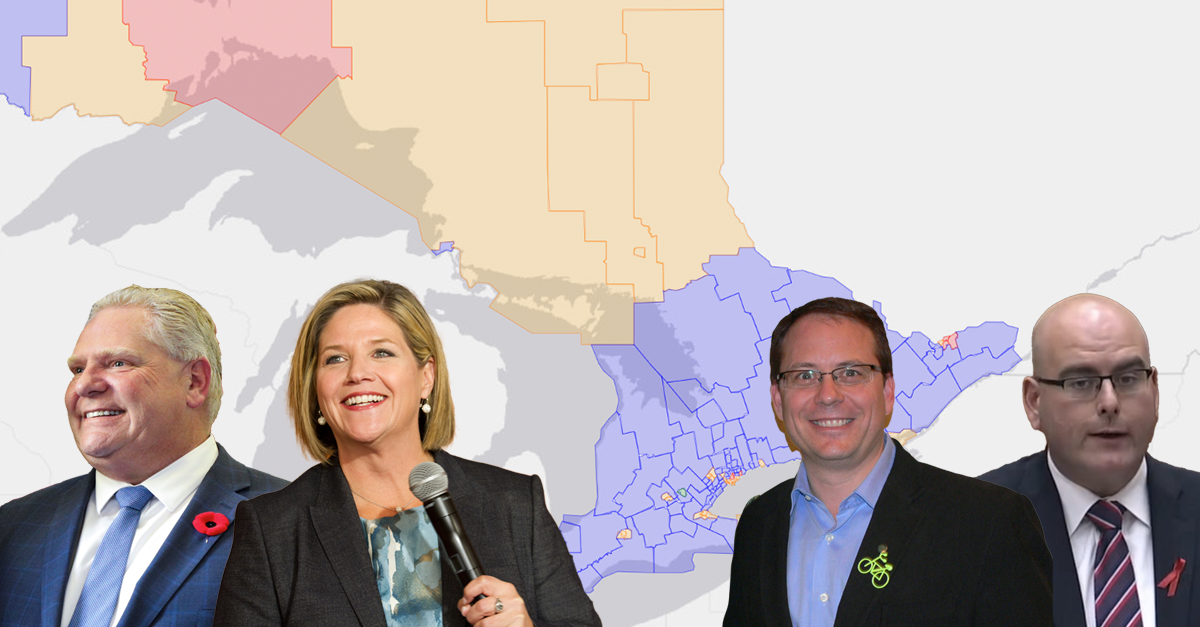
I just finished mapping out Doug Ford’s Progressive Conservative election win from 2022. On June 2 of that year, the voters of Ontario returned the PC leader with a majority government with 83 seats. The Progressive Conservatives defeated the Ontario Liberals led by Steven Del Duca and the Ontario NDP which was helmed by Andrea Horwath. Both defeated party leaders would move on from provincial politics and have since become the mayors of Vaughan and Hamilton, respectively.

The results of this pandemic-era election were very much similar to the 2018 provincial election – another majority for the PC under Ford – but the election saw a strenghthened mandate for the Premier. One independent candidate was elected in Haldimand–Norfolk.

This is the sixth election I’ve mapped out for the province of Ontario. You can review all of those elections here and drill down on the results of this one using the provincial map.

The mapped results of the 2022 Ontario Provincial election

Clicking/tapping on a riding will zoom you into the map for a poll-by-poll breakdown. You can dive into your own riding and find out how your neighbours voted! Hovering over ridings or neighbourhood polls will show a pie chart breakdown of the proportion of votes in a particular area. Expanding the tile at the bottom right and switching to the “Turnout” tab will show voter turnout rates on a riding level or can show poll-by-poll rates of partipation.

Scarborough Centre coloured by poll winner.

You can also use the search bar at the top of the page to search for any candidate or riding over the last 6 elections. Some candidates appear more than once and you can track their electoral history (no matter which riding they may have contested). Clicking on a riding will also show a “related content” button at the top of the page which you can use to find the results of nearby ridings. A few of those ridings are also summarized below the map.

Green party win in Guelph shaded by the strength of the Progressive Conservative vote (ironically the colour green showing strongest PC areas here). Mike Schreiner, the Green Party leader won the party’s only seat.

If you’re wondering how to take these screenshots to put these images in your own posts or tweets, click the camera at the top left of the map. This will download an image of the map.

Zooming around the map is a lot of fun. It’s vector-based, so zooming in and out is smooth and looks great.

Clicking the “Up to 2022 Provincial Election” button in the top right zooms the map out to the provincial riding context, while clicking on a riding zooms in to show the local breakdown.

A particularly strong neighbourhood poll for PC candidate Doug Ford in Etobicoke North.

I’ve integrated building footprints for all of Ontario (and Canada) into my map, so you can see grouping of houses on cul-de-sacs, apartment buildings, and in some cases even the house numbers.

NDP leader Andrea Horwath best poll in Hamilton Centre.

Visualizing these building footprints in neighbourhoods for various polls is a new feature of this iteration of these maps. I’ve also extended this feature to my previous maps (both federal and provincial). It can be useful to consider different zoning and dwelling types when appreciating party strength in a riding.

Liberal leader Steven Del Duca did not have a great showing in his riding of Vaughan–Woodbridge.

I enjoy pulling these maps together for the broader political community and to help voters further engage with our democratic process. I’ll be mapping other provincial elections as that data becomes available from the relevant provincial elections agencies.

York South–Weston showing a diversity of voting preferences throughout the riding.

Mapping the results of the 2018 Ontario provincial election

Some of you may be up to more interesting things on the Victoria Day long weekend, but given that we’re into the most important period of a provincial election in Ontario at the moment – I thought I’d take some time and mash-up, clean-up, and mark-up data from Elections Ontario of the last provincial election to give us some important historical context for the vote coming up on June 2nd.

Jump in and explore the mapping tool I built.

The results of the 2018 Ontario provincial election

As with my previous mapping efforts, I’m sharing these as a non-partisan resource for all political volunteers who find a lot of use for political maps in campaign offices. If you appreciate that effort, write a nice tweet about the project, or better yet blog about it – if you still do that kind of thing.

The 2018 provincial election saw the end of the 19-year Ontario Liberal dynasty with the election of the newly-minted Progressive Conservative leader Doug Ford after the dramatic ouster of Patrick Brown from the job just months earlier. Ford won a majority government in 2018 and is now looking to increase his seat total in this year’s contest.

Patrick Brown’s former riding of Simcoe North was easily retained by the PCs in 2018

Ford struggled – as all government leaders did – with administration during the COVID-19 pandemic. We’ve just seen Alberta Premier Jason Kenney fall to populist discontent within his own party due to his own balancing of individual liberties versus public health during the crisis. Ford has faced similar criticism but looks to have wealthered the storm. Calling an election during a downtime in COVID cycles – and as Ontarians are off to the cottage – will likely see Ford return to the Premier’s Office when all of the votes are counted. We’re also expecting lower-than-usual voter turnout which usually favours incumbents.

Premier Doug Ford won the riding of Etobicoke North

As I’ve mentioned, the Ontario Liberals were wiped-out in 2018, being reduced to 7 seats. Putting the results on the map shows us their Toronto and Ottawa urban strongholds and where they may seek to increase their totals this year with their new leader Steven Del Duca.

The Liberal electoral map in Toronto looked quite different in 2018

Over on team-orange, this is NDP leader Andrea Horwath’s fourth election as head of her party. With falling Liberal fortunes in 2018, the Ontario NDP more than doubled their seats to 40. The riding distribution shows NDP strength in Toronto, Kingston, London, Niagara region, and Windsor.

The NDP won every poll in London–Fanshawe in 2018. Seeing the NDP win every poll in a riding is a rare sight.

Organized labour could also be a factor in redrawing the map. Labour Minister Monte McNaughton’s work in his portfolio has split up Progressives and the dreaded Working Families Coalition. Many of the founding members of the coalition – including the Ontario Pipe Trades Council, the International Brotherhood of Boilermakers, and the International Brotherhood of Electrical Workers – have endorsed the re-election of Progressive Conservatives and a refreshed mandate for Ford as Premier.

Monte McNaughton’s won the riding of Lambton—Kent—Middlesex. The NDP won one poll on the western edge of the riding

By most accounts, Green Party leader Mike Schreiner impressed the province during the Ontario Leaders debate. His opposition to highway 413 and greenbelt issues may translate into additional seats for the Greens. With a split on the left between Liberal and NDP support, we could see Ontario progressives rally with strong green representation in some ridings. However, it’s more likely that this will clear the way for additional Progressive Conservative gains.

Green Party leader Mike Schreiner won Guelph in 2018. Here, his strength in the riding is mapped by poll from maximum (green) to minimum strength (red)
Schreiner won most of the polls

I’ve mapped out areas of strength in each riding for each candidate that ran in 2018. Whether your party was successful or not in your local riding, you can see where it’s strength is growing or declining and these maps can help you focus on neighbourhoods where you can get out the vote. Whether you’re actively campaigning or not, you can also use these maps to see the distribution of party strength geographically within a riding using these strength/weakness settings for the poll-by-poll maps. How did your neighbours vote? Find out!

The NDP carried the riding of Hamilton West—Ancaster—Dundas in 2018. You can see their urban vs rural strength mapped here.

There’s a search bar at the top of the app as well so you can easily zoom around the province if you know the riding you want to look at but can’t exactly remember its geospatial position. Future updates will include a method to jump around to neighbouring ridings and to look at the results of previous Ontario elections in context. I’ve already added these features to my federal maps, so do check those out as well if you believe that the 2021 federal election provides some helpful context for this current provicial election.

The many minds of Kingston and the Islands. CFB Kingston is to the east, Queen’s University and the Prisons are to the West and the Liberal cottages are on the nicer part of Wolfe Island

Hopefully you find this to be a useful resource if you’re colouring in maps in a campaign office, or if you just can’t get enough of Canadian politics. If you are neither, I hope you’ll still find the visualization of Ontario electoral politics to give you some bearings on the priorities of your community.

So give the map database a try and geolocate your vote!

Rob Ford set to run for Toronto mayor

Yesterday I heard this Toronto municipal news tidbit from a source close to Rob Ford’s camp who says that the conservative city councilor is “definitely in” for a shot at taking over the mayor’s office, a post to be vacated by David Miller in the next year. Today, I called Ford himself and confirmed that he had a couple of items to address with his business before he gets going on the campaign and that he plans to announce in March.

Those close to Ford say that he is building an organization and gathering the money needed to make a top tier shot at Toronto’s top job.

Ford won the #2 Etobicoke North ward with 66% of the vote during the last municipal election. Ford supporters that are concerned that the popular candidate is vacating a conservative seat on council may be relieved to hear that Ford’s brother plans on running in his place.

UPDATE: Ford is now denying the story. I should say that I spoke to him on his cell phone (last four digits: 2146) because I wanted to confirm it with the man himself. I had heard the rumour yesterday and sought to exercise due diligence by confirming it with Ford before running with the story. I told Ford exactly who I was and that I generally cover federal politics but was chasing down a municipal rumour. He told me in no uncertain terms that he’s looking to wrap up a few outstanding issues with his business (with clients in New Jersey, no less) and is looking to make the announcement in March. Excited by the scoop I thanked him and even told him that he’d probably be getting a few calls after I posted the story.