Elections Polling Census

Canadian Political Data

Election results, polling and demographics for every level of Canadian government: the House of Commons, all 13 provincial and territorial legislatures, and major city councils. Explore riding and poll-by-poll maps, follow the polls in every province, and see how the places that vote differently differ.

Federal riding, provincial district and municipal ward, each linked to its results map.

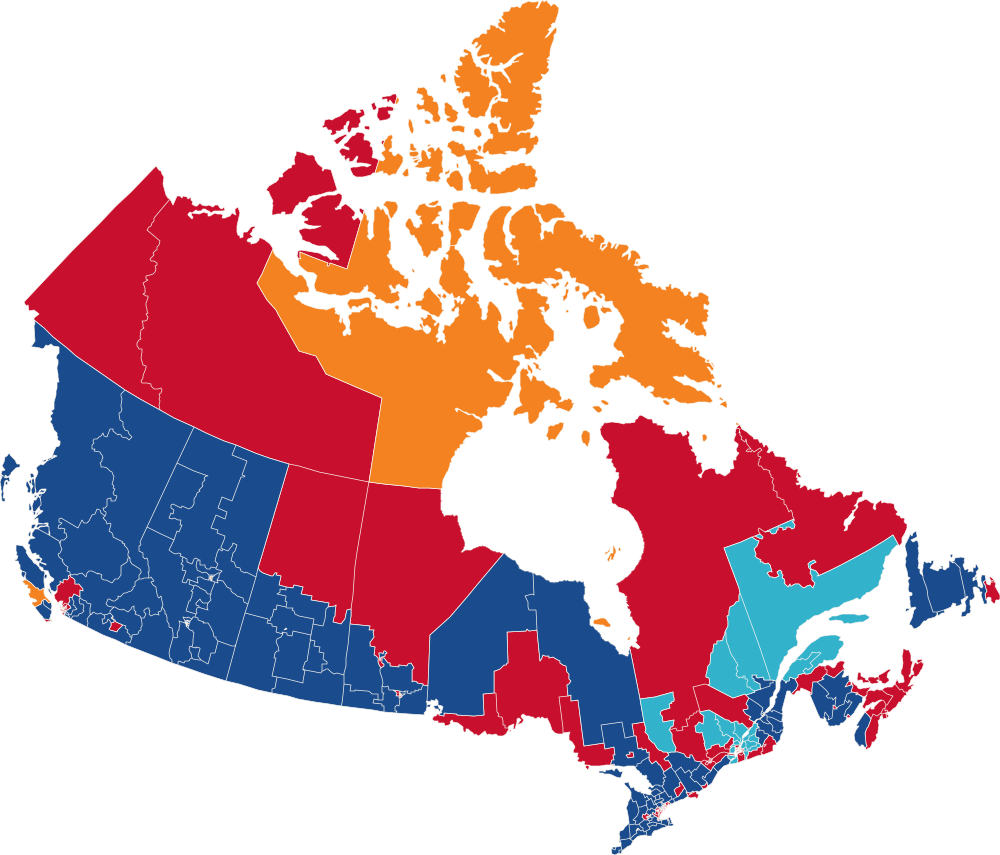
Map of Canada's 343 federal ridings, each in the colour of the party that won it in 2025

2025 federal election. The party that won each of the 343 ridings.

  • Liberal169
  • Conservative144
  • Bloc Québécois22
  • NDP7
  • Green1

Explore the 2025 results mapSource: Elections Canada

Calendar

Elections across Canada

Federal, provincial and municipal elections, referendums and census releases, from what was just decided to what’s next.

Coming up

  1. Alberta referendumReferendum In 5 days
  2. British Columbia general electionProvincial In 10 days
  3. Ontario municipal electionsMunicipal In 12 days
  4. Manitoba municipal electionsMunicipal In 14 days
  5. Prince Edward Island municipal electionsMunicipal In 19 days

The data

What you can explore here

Every election level, from the House of Commons to city councils, with the census alongside.

  • 9general elections, 2000–2025

    Seats won in 2025

    Federal

    Federal elections

    Riding and poll-by-poll results for every general election since 2000, with swing maps between elections.

  • Provincial

    Provincial and territorial elections

    All 13 provinces and territories, with riding and poll-level maps and polling histories.

  • 14cities

    Toronto · Montreal · Vancouver · Calgary · Ottawa · Edmonton · Winnipeg · Windsor · London · Oshawa · Hamilton · Waterloo · Orillia · Niagara Falls

    Municipal

    Municipal elections

    Ward and poll-level results, including mayoral and school trustee races.

  • By-elections

    By-elections

    67 federal and 88 provincial by-elections mapped by poll.

    Federal →Provincial →

  • 11races mapped by riding

    Conservative Party of British Columbia 2026 · Liberal Party of Canada 2025 · Ontario Liberal Party 2023 · Conservative Party of Canada 2022 and 7 more

    Leadership

    Leadership races

    Party leadership votes mapped by riding, and the overall results of the others.

    Federal →Provincial →

  • Census

    Census

    20 topics from the 2021 Census, mapped by federal riding, postal code area and neighbourhood.

Polling

The polls, everywhere they're taken

An average of published polls for Parliament, each provincial and territorial legislature with recent polling, and the mayoral races in Toronto and Vancouver. Every jurisdiction gets the same space; select one for its full polling history.

Elections coming up

Between elections

Each line is a weighted average of published polls; dots are individual polls and the band shows their spread. How the polling averages work. Polls from Wikipedia’s opinion polling tables, updated daily; data as of October 9, 2026.

Seat projections from these polls

Federal

No election has been called: the seats each party would win if one were held at the time of the polls.

Latest projection: polls to 13 October 2026, 240 polls

Projected seats by party: median and 90% range, out of 343
Liberal230163–280
Conservative7736–137
Bloc Québécois204–34
NDP145–23
Green20–3

Chance of a majority (172 of 343 seats): Liberal 93%, Conservative 1%; none 5%

Bars: median seats; lines: the middle 90% of simulations.

The full projection

British Columbia

General election of 24 October 2026.

Latest projection: polls to 12 October 2026, 53 polls

Projected seats by party: median and 90% range, out of 93
Conservative5332–73
NDP3819–59
Green10–3

Chance of a majority (47 of 93 seats): Conservative 72%, NDP 24%; none 5%

Bars: median seats; lines: the middle 90% of simulations.

The full projection

Analysis

Demographics and the vote

How the 2025 federal vote in each of the 343 ridings lines up with who lives there, from the 2021 Census. Choose a measure and a party to compare.

  • Winner
  • Liberal
  • Conservative
  • NDP
  • Bloc Québécois
  • Green

342 ridings · r = −0.55

0102030405060708090Conservative share of the vote (%)102030405060708090Households that rent (% of households) →

Across 342 ridings, the Conservative share falls as the share of households that rent rises (r = −0.55).

Each dot is a riding, not a voter: the pattern describes places, not how individuals voted. Census figures are from 2021; the votes were cast in April 2025. The line is a local (LOESS) trend; r measures how closely the ridings follow a straight line, from −1 to 1. One riding with no Conservative candidate is left out.

Sources: Elections Canada (2025 results); Statistics Canada, 2021 Census, aggregated from dissemination areas to the 2023 ridings. Income and median age are riding averages of neighbourhood medians, so they are approximate.

Data table

SourcesResults from Elections Canada, the provincial and territorial election agencies, and municipal open data. Census figures from Statistics Canada; address lookups use Statistics Canada’s National Address Register. Prediction market odds from Polymarket. Built and maintained by Stephen Taylor; every page lists its data source, and corrections are welcome.