I just finished mapping out Doug Ford’s Progressive Conservative election win from 2022. On June 2 of that year, the voters of Ontario returned the PC leader with a majority government with 83 seats. The Progressive Conservatives defeated the Ontario Liberals led by Steven Del Duca and the Ontario NDP which was helmed by Andrea Horwath. Both defeated party leaders would move on from provincial politics and have since become the mayors of Vaughan and Hamilton, respectively.
The results of this pandemic-era election were very much similar to the 2018 provincial election – another majority for the PC under Ford – but the election saw a strenghthened mandate for the Premier. One independent candidate was elected in Haldimand–Norfolk.
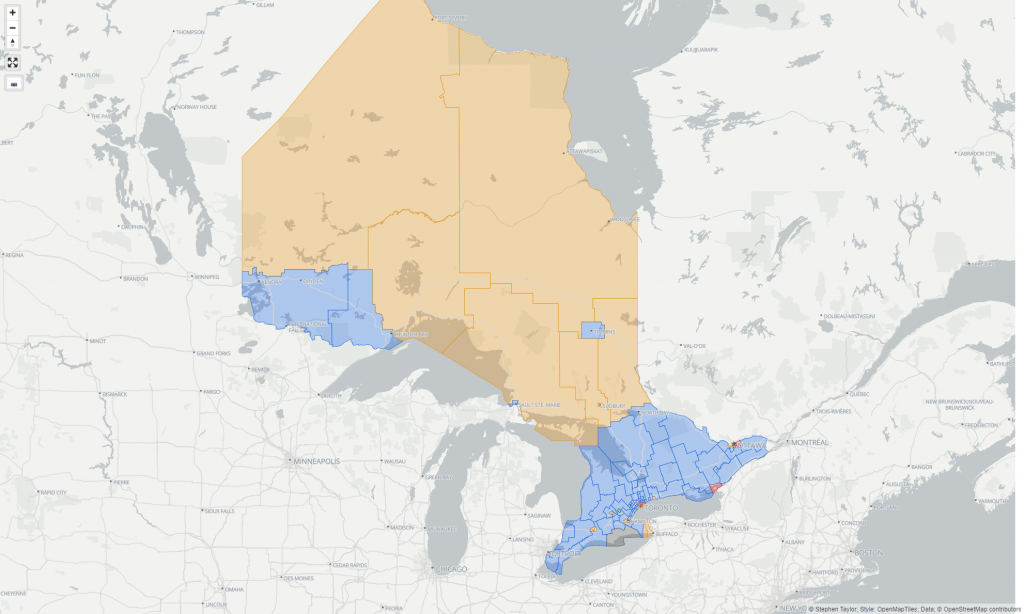
This is the sixth election I’ve mapped out for the province of Ontario. You can review all of those elections here and drill down on the results of this one using the provincial map.
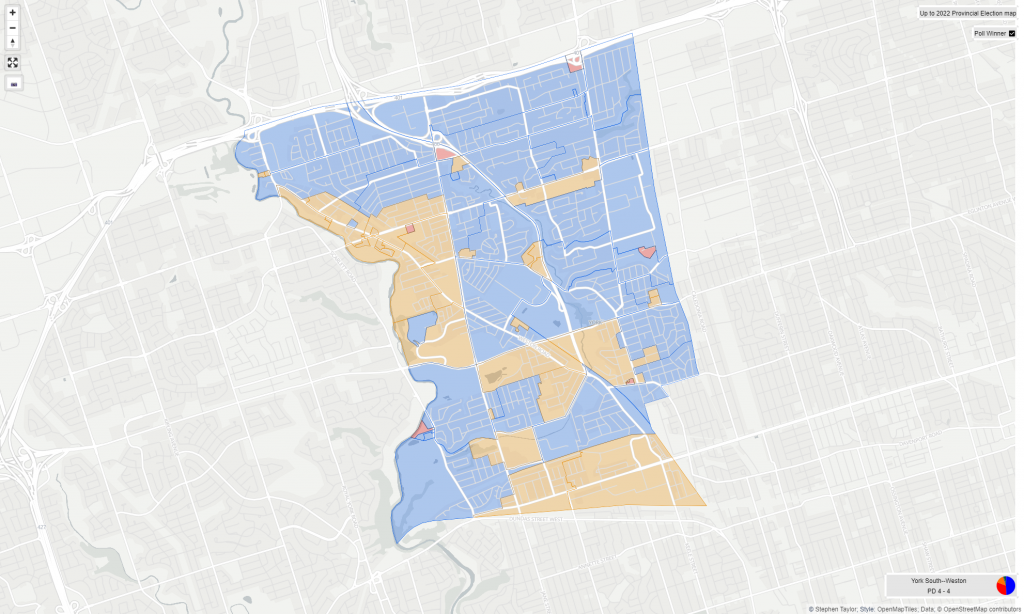
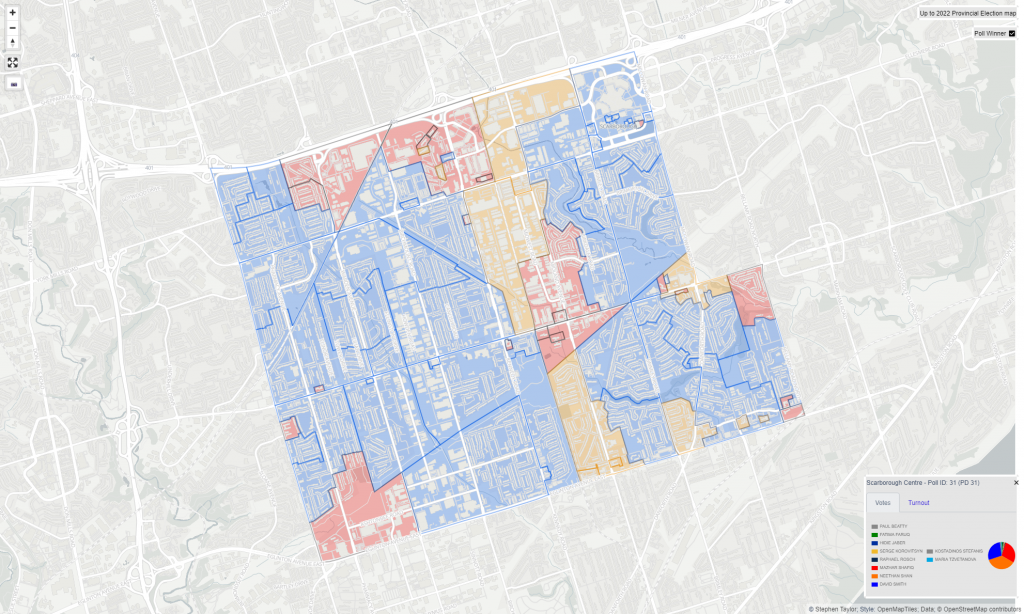
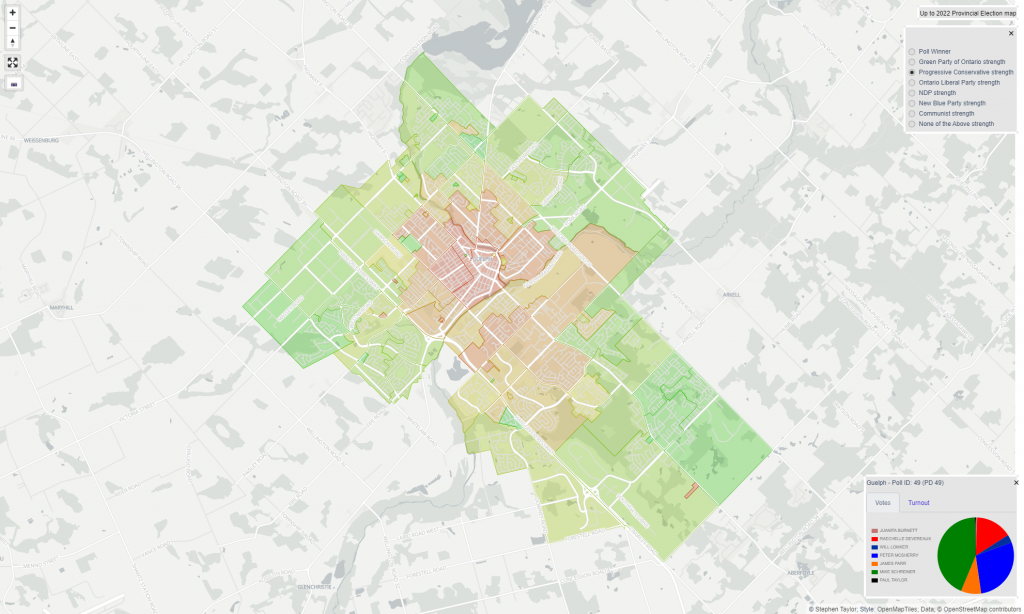
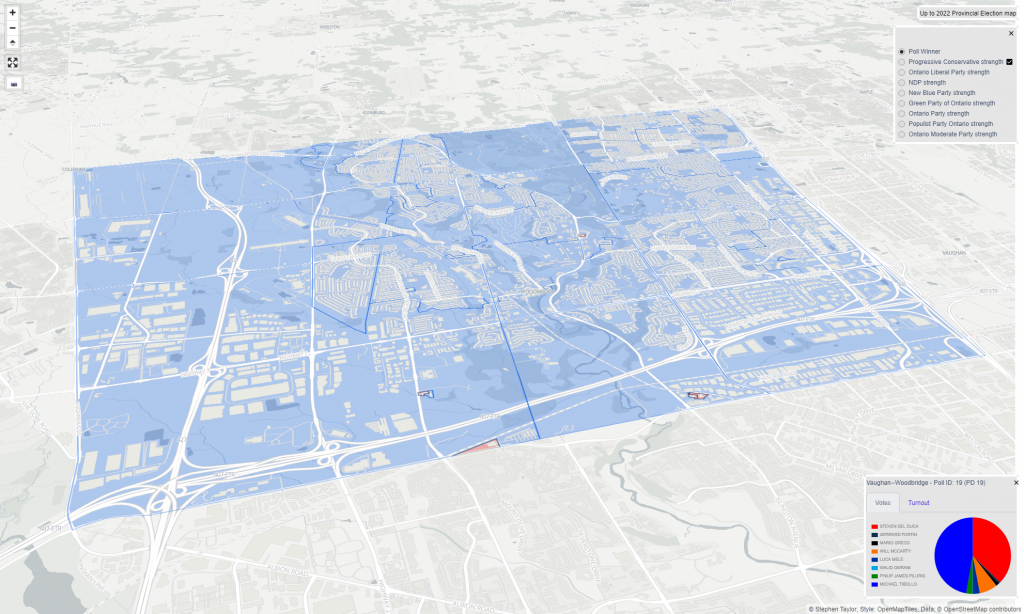
Clicking/tapping on a riding will zoom you into the map for a poll-by-poll breakdown. You can dive into your own riding and find out how your neighbours voted! Hovering over ridings or neighbourhood polls will show a pie chart breakdown of the proportion of votes in a particular area. Expanding the tile at the bottom right and switching to the “Turnout” tab will show voter turnout rates on a riding level or can show poll-by-poll rates of partipation.
You can also use the search bar at the top of the page to search for any candidate or riding over the last 6 elections. Some candidates appear more than once and you can track their electoral history (no matter which riding they may have contested). Clicking on a riding will also show a “related content” button at the top of the page which you can use to find the results of nearby ridings. A few of those ridings are also summarized below the map.
If you’re wondering how to take these screenshots to put these images in your own posts or tweets, click the camera at the top left of the map. This will download an image of the map.
Zooming around the map is a lot of fun. It’s vector-based, so zooming in and out is smooth and looks great.
Clicking the “Up to 2022 Provincial Election” button in the top right zooms the map out to the provincial riding context, while clicking on a riding zooms in to show the local breakdown.
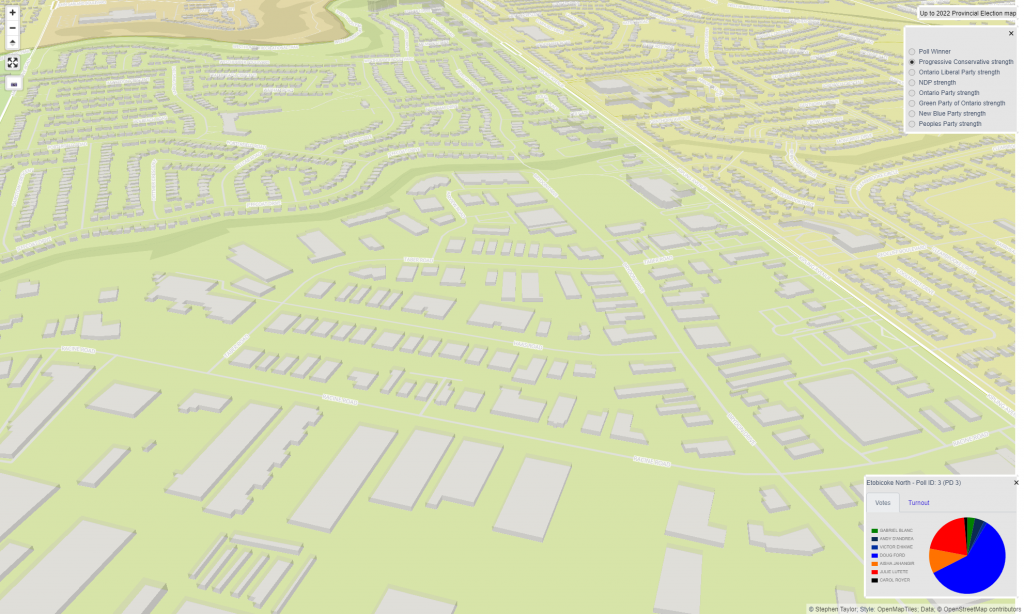
I’ve integrated building footprints for all of Ontario (and Canada) into my map, so you can see grouping of houses on cul-de-sacs, apartment buildings, and in some cases even the house numbers.
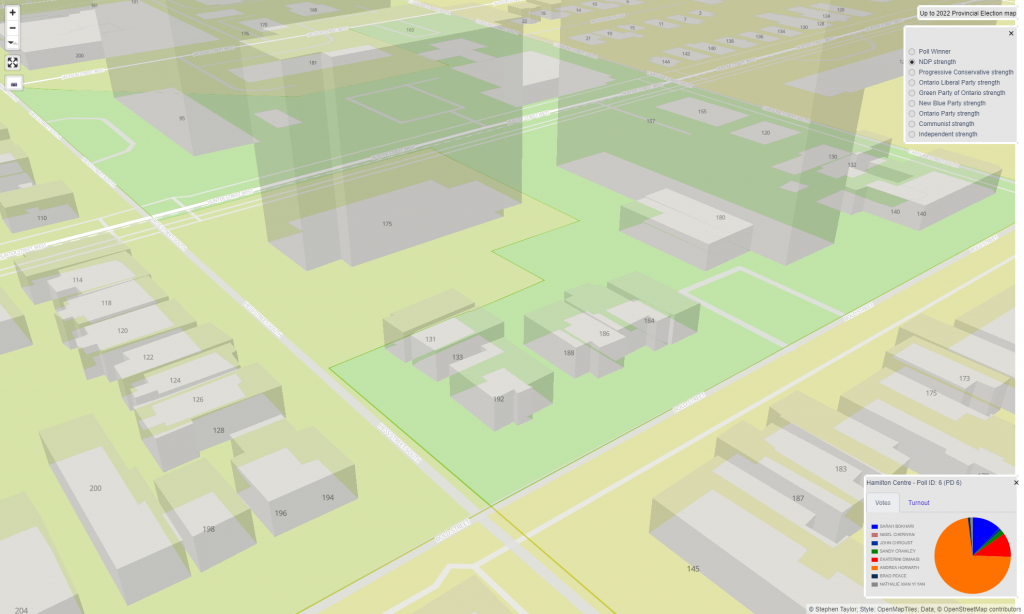
Visualizing these building footprints in neighbourhoods for various polls is a new feature of this iteration of these maps. I’ve also extended this feature to my previous maps (both federal and provincial). It can be useful to consider different zoning and dwelling types when appreciating party strength in a riding.
I enjoy pulling these maps together for the broader political community and to help voters further engage with our democratic process. I’ll be mapping other provincial elections as that data becomes available from the relevant provincial elections agencies.