Mapping the results of the 2018 Ontario provincial election
Some of you may be up to more interesting things on the Victoria Day long weekend, but given that we’re into the most important period of a provincial election in Ontario at the moment – I thought I’d take some time and mash-up, clean-up, and mark-up data from Elections Ontario of the last provincial election to give us some important historical context for the vote coming up on June 2nd.
Jump in and explore the mapping tool I built.
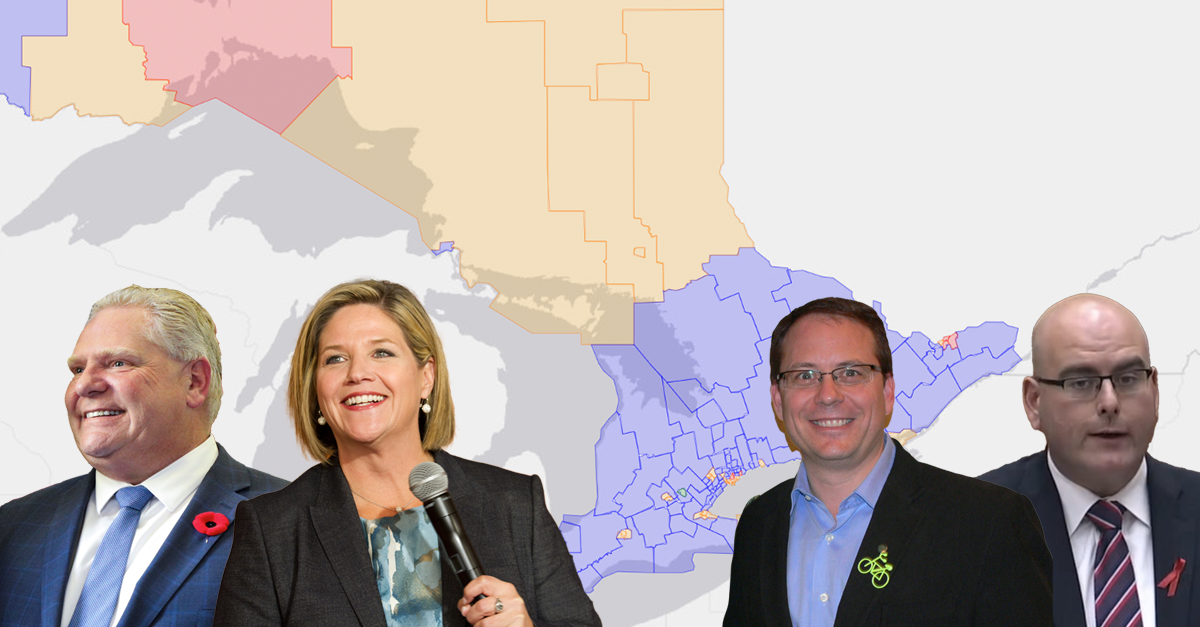
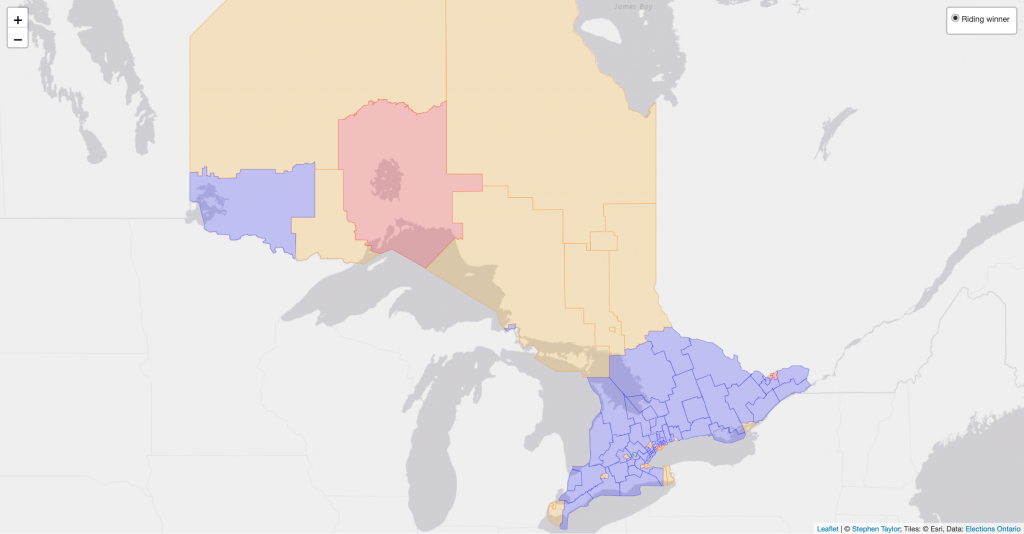 The results of the 2018 Ontario provincial election
For deeper analysis and exclusive posts, subscribe to my Substack.
As with my previous mapping efforts, I’m sharing these as a non-partisan resource for all political volunteers who find a lot of use for political maps in campaign offices. If you appreciate that effort, write a nice tweet about the project, or better yet blog about it – if you still do that kind of thing.
The 2018 provincial election saw the end of the 19-year Ontario Liberal dynasty with the election of the newly-minted Progressive Conservative leader Doug Ford after the dramatic ouster of Patrick Brown from the job just months earlier. Ford won a majority government in 2018 and is now looking to increase his seat total in this year’s contest.
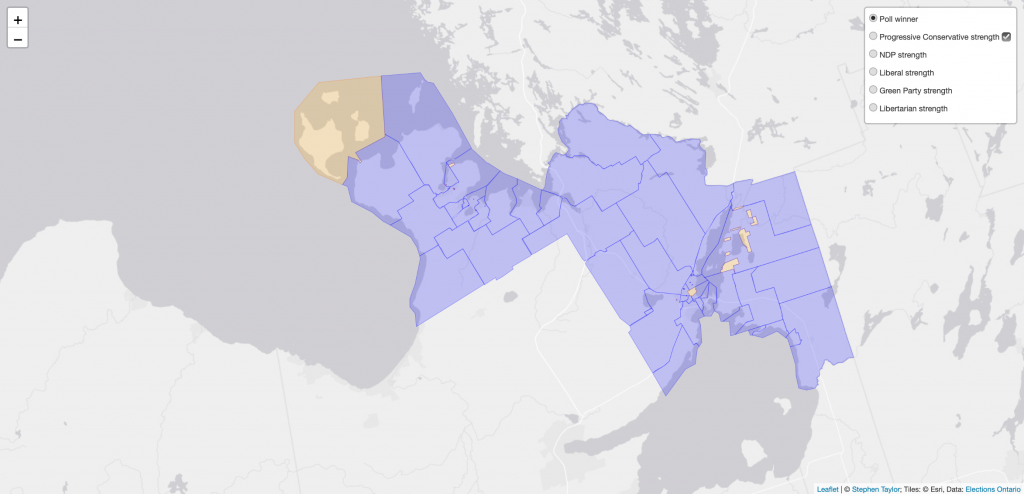 * Patrick Brown’s former riding of Simcoe North was easily retained by the PCs in 2018*
Ford struggled – as all government leaders did – with administration during the COVID-19 pandemic. We’ve just seen Alberta Premier Jason Kenney fall to populist discontent within his own party due to his own balancing of individual liberties versus public health during the crisis. Ford has faced similar criticism but looks to have wealthered the storm. Calling an election during a downtime in COVID cycles – and as Ontarians are off to the cottage – will likely see Ford return to the Premier’s Office when all of the votes are counted. We’re also expecting lower-than-usual voter turnout which usually favours incumbents.
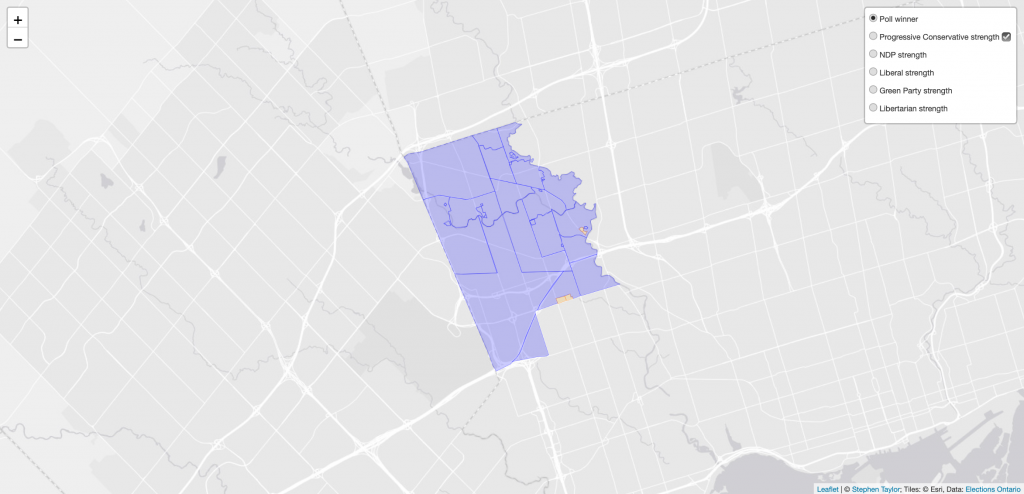 Premier Doug Ford won the riding of Etobicoke North
As I’ve mentioned, the Ontario Liberals were wiped-out in 2018, being reduced to 7 seats. Putting the results on the map shows us their Toronto and Ottawa urban strongholds and where they may seek to increase their totals this year with their new leader Steven Del Duca.
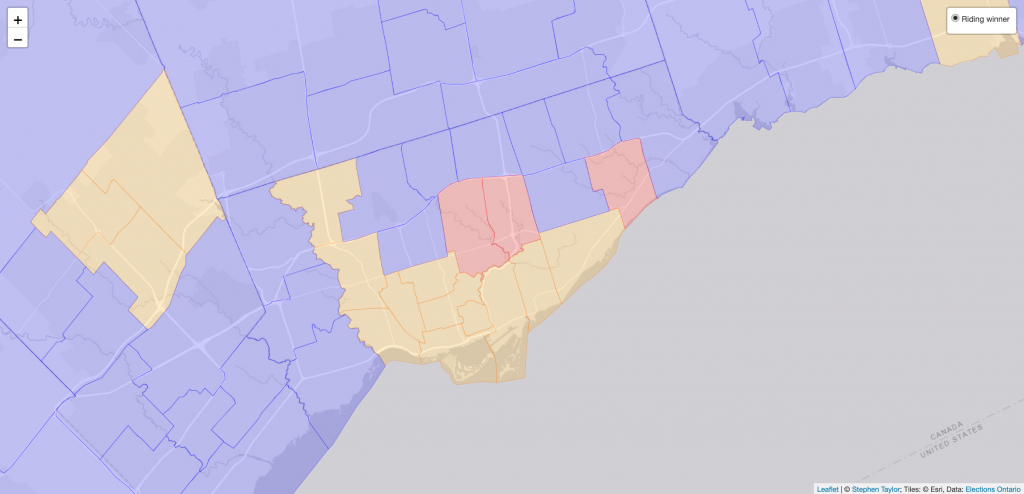 The Liberal electoral map in Toronto looked quite different in 2018
Over on team-orange, this is NDP leader Andrea Horwath’s fourth election as head of her party. With falling Liberal fortunes in 2018, the Ontario NDP more than doubled their seats to 40. The riding distribution shows NDP strength in Toronto, Kingston, London, Niagara region, and Windsor.
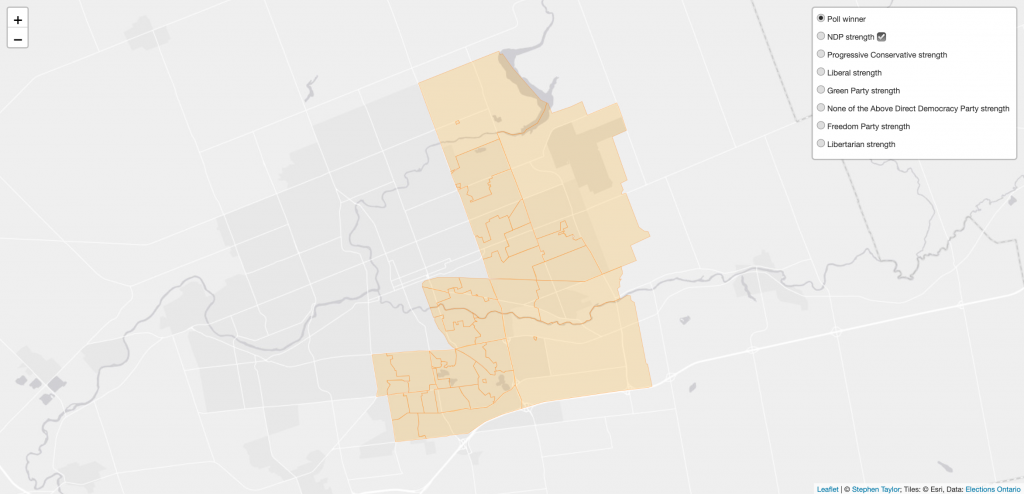 The NDP won every poll in London–Fanshawe in 2018. Seeing the NDP win every poll in a riding is a rare sight.
Organized labour could also be a factor in redrawing the map. Labour Minister Monte McNaughton’s work in his portfolio has split up Progressives and the dreaded Working Families Coalition. Many of the founding members of the coalition – including the Ontario Pipe Trades Council, the International Brotherhood of Boilermakers, and the International Brotherhood of Electrical Workers – have endorsed the re-election of Progressive Conservatives and a refreshed mandate for Ford as Premier.
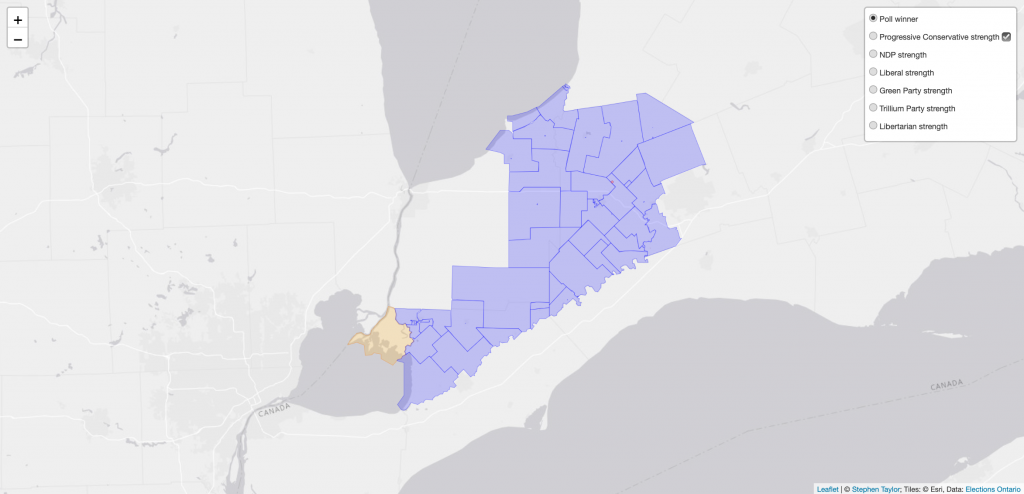 Monte McNaughton’s won the riding of Lambton—Kent—Middlesex. The NDP won one poll on the western edge of the riding
By most accounts, Green Party leader Mike Schreiner impressed the province during the Ontario Leaders debate. His opposition to highway 413 and greenbelt issues may translate into additional seats for the Greens. With a split on the left between Liberal and NDP support, we could see Ontario progressives rally with strong green representation in some ridings. However, it’s more likely that this will clear the way for additional Progressive Conservative gains.
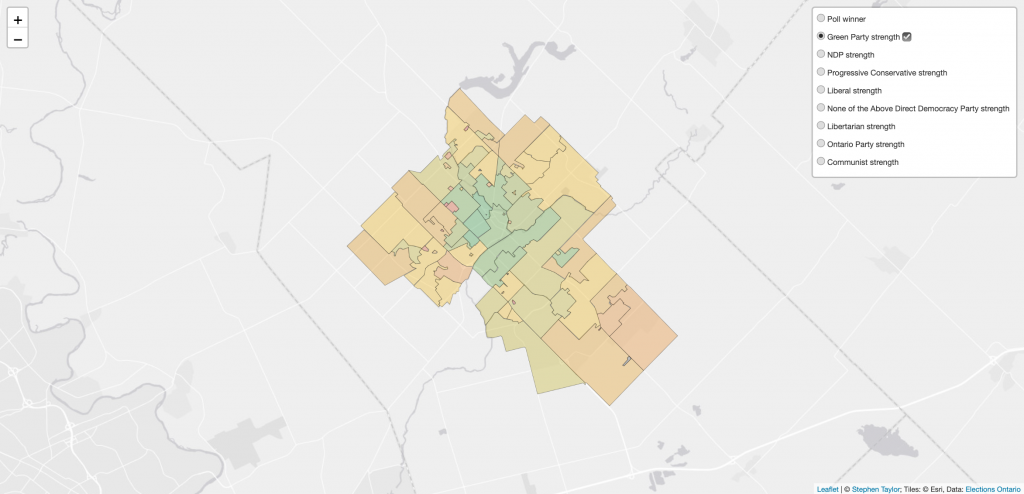 Green Party leader Mike Schreiner won Guelph in 2018. Here, his strength in the riding is mapped by poll from maximum (green) to minimum strength (red)
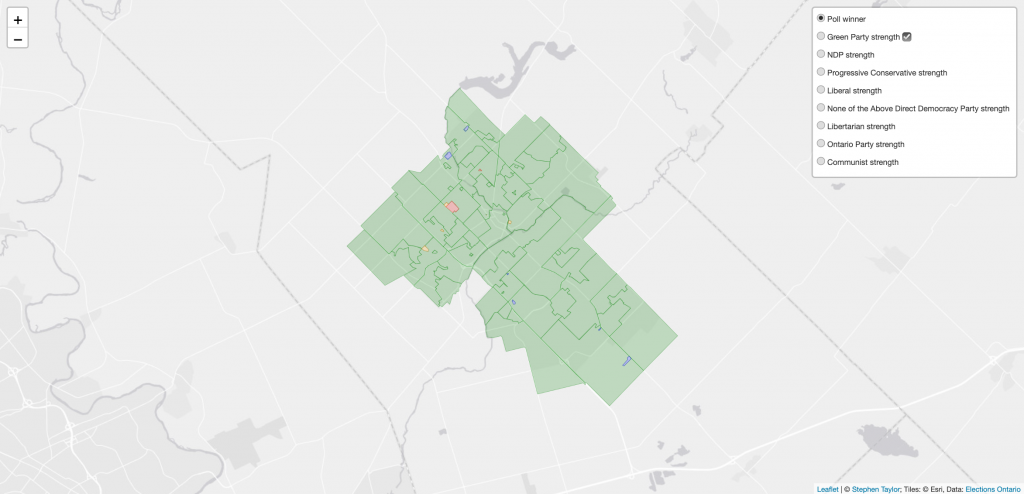 Schreiner won most of the polls
I’ve mapped out areas of strength in each riding for each candidate that ran in 2018. Whether your party was successful or not in your local riding, you can see where it’s strength is growing or declining and these maps can help you focus on neighbourhoods where you can get out the vote. Whether you’re actively campaigning or not, you can also use these maps to see the distribution of party strength geographically within a riding using these strength/weakness settings for the poll-by-poll maps. How did your neighbours vote? Find out!
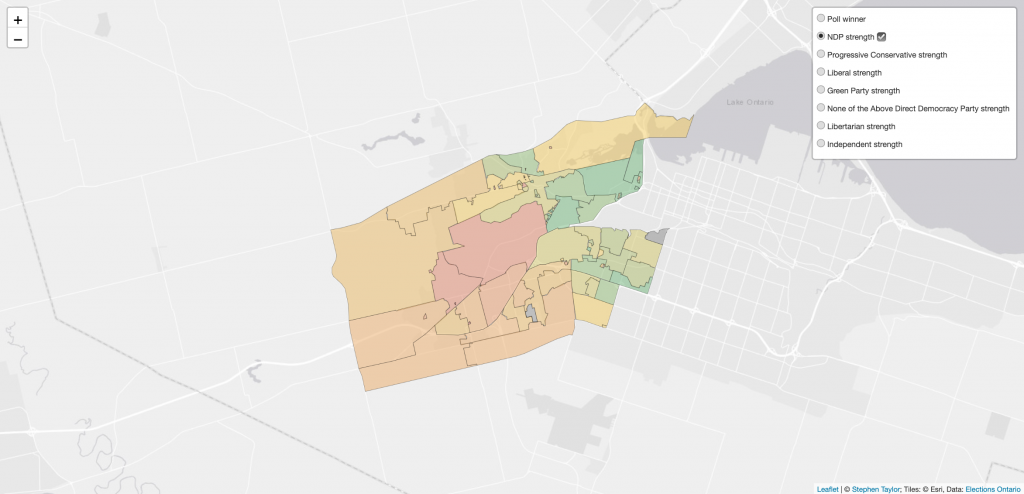 The NDP carried the riding of Hamilton West—Ancaster—Dundas in 2018. You can see their urban vs rural strength mapped here.
There’s a search bar at the top of the app as well so you can easily zoom around the province if you know the riding you want to look at but can’t exactly remember its geospatial position. Future updates will include a method to jump around to neighbouring ridings and to look at the results of previous Ontario elections in context. I’ve already added these features to my federal maps, so do check those out as well if you believe that the 2021 federal election provides some helpful context for this current provicial election.
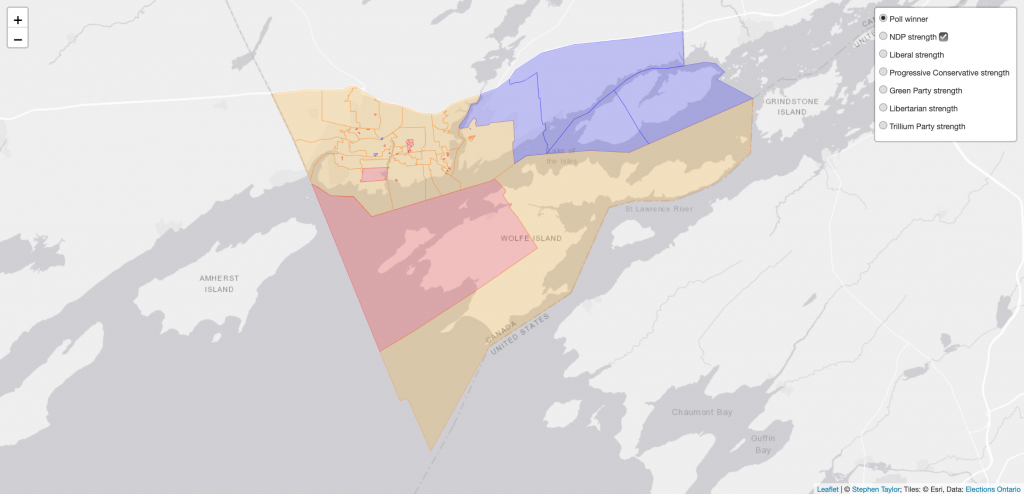 The many minds of Kingston and the Islands. CFB Kingston is to the east, Queen’s University and the Prisons are to the West and the Liberal cottages are on the nicer part of Wolfe Island
Hopefully you find this to be a useful resource if you’re colouring in maps in a campaign office, or if you just can’t get enough of Canadian politics. If you are neither, I hope you’ll still find the visualization of Ontario electoral politics to give you some bearings on the priorities of your community.
So give the map database a try and geolocate your vote!
Related Posts

Mapping the results of the 2022 Ontario Provincial Election
I just finished mapping out Doug Ford’s Progressive Conservative election win from 2022. On June 2 of that year, the voters of Ontario returned the PC leader…

How many memberships did Pierre Poilievre sell?
The second half of the Conservative Party leadership race is now underway. Midnight on June 4th represented the cut-off for new memberships sold for party…
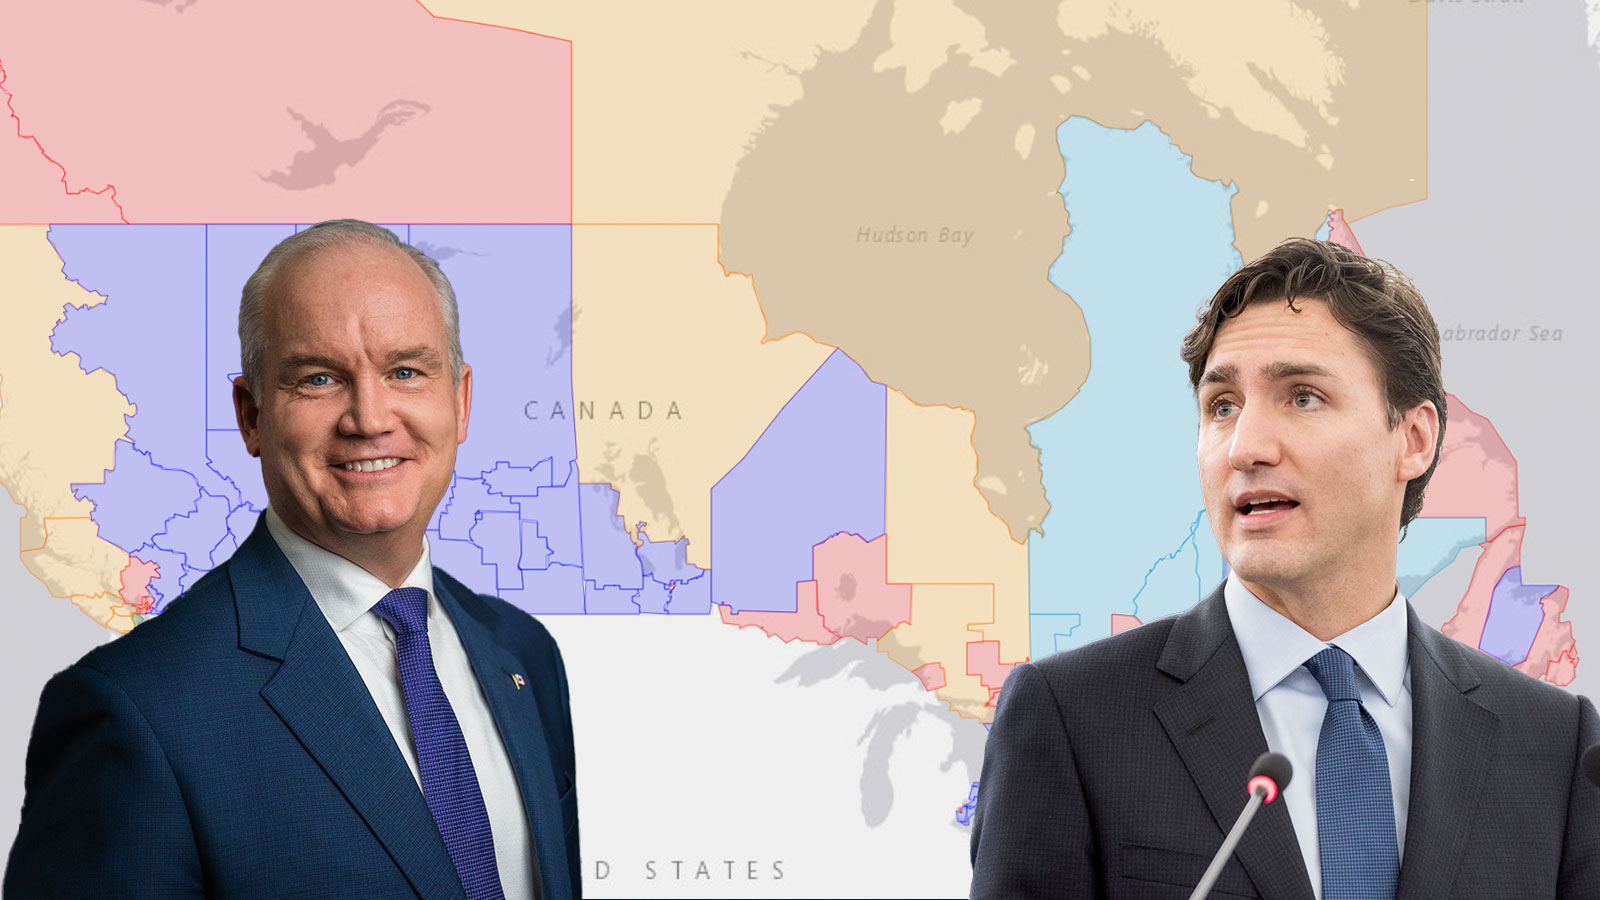
Mapped Results of the 2021 Canadian Federal Election
Elections Canada has just released the official results of 2021 Canadian federal election. The official voting results present the results of the election in…