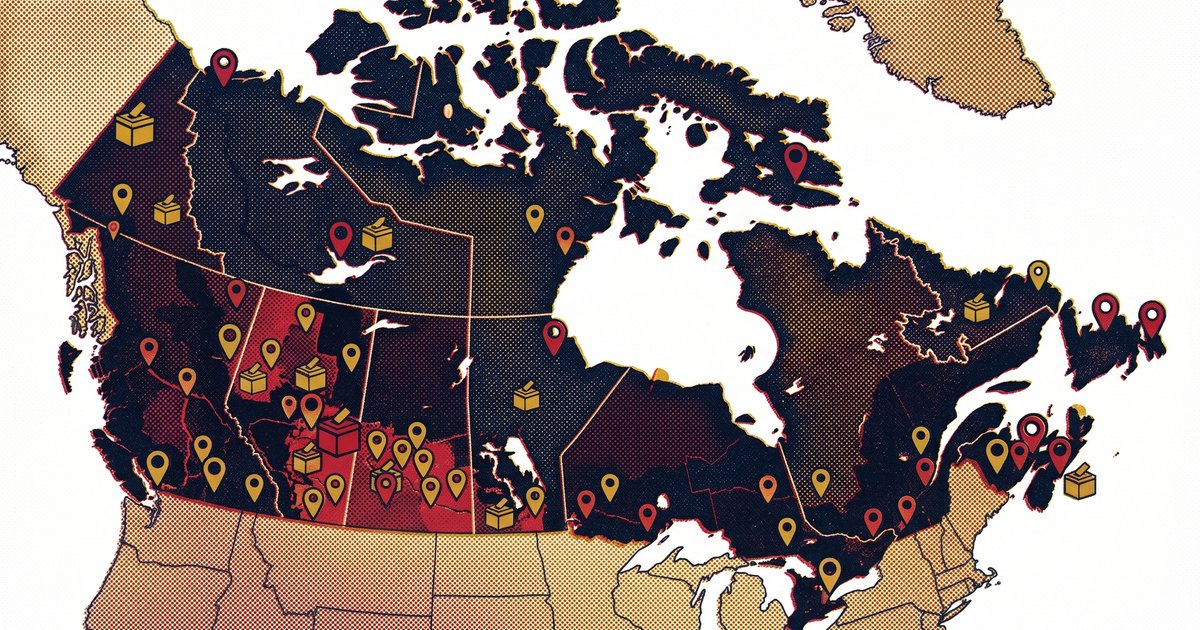
Mapped Results of the 2021 Canadian Federal Election
Elections Canada has just released the official results of 2021 Canadian federal election.
The official voting results present the results of the election in much greater detail than the validated results that were shared immediately after the election. While the results themselves do not change, the official voting results provide more context by combining multiple data sources—including updated data on the number of registered electors, demographic information on candidates and poll-by-poll results—and presenting the data as a complete package, shared in multiple formats.
Elections Canada
For deeper analysis and exclusive posts, subscribe to my Substack.
This detailed CSV files of these results were released on April 7th and include the poll-by-poll tallies of the 338 ridings. Those polls are neighbourhood-sized slices of Canada of under 1000 electors (some neighbourhoods are bigger depending on the geography, of course). There are, by my count, 69997 polling divisions in Canada.
As I do, I stayed up all night to crunch through the data and plot it in map format. This, because I know you prefer not to consume your elections data via spreadsheet.
You can dive in by starting at the national map and clicking on any riding of your choosing.
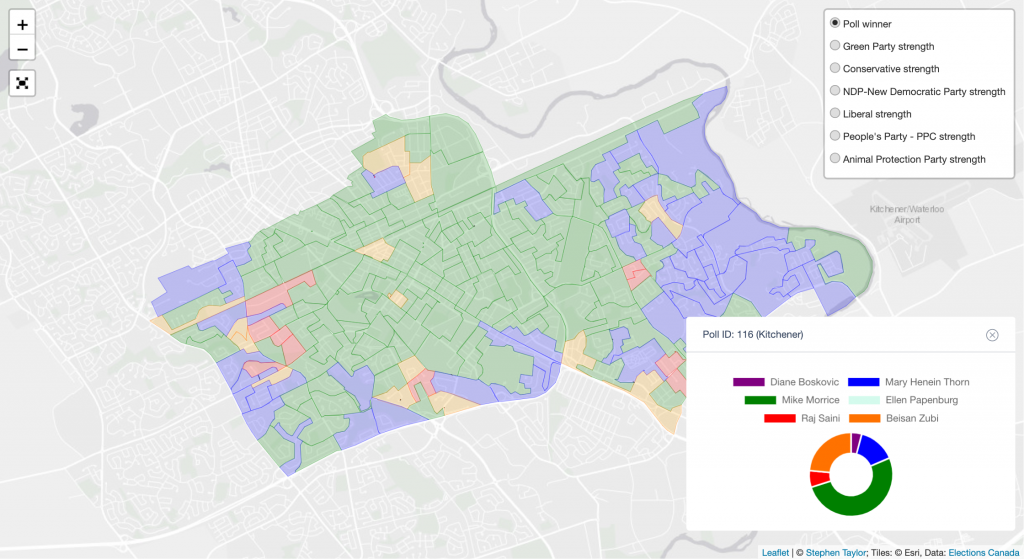 Kitchener Centre was picked up by the Green Party
It’s still early so I haven’t done too much analysis on these maps yet (please tell me what you discover!)
As we all know, Justin Trudeau was held to a minority government with no significant change in the seats between the Liberals and Conservative parties.
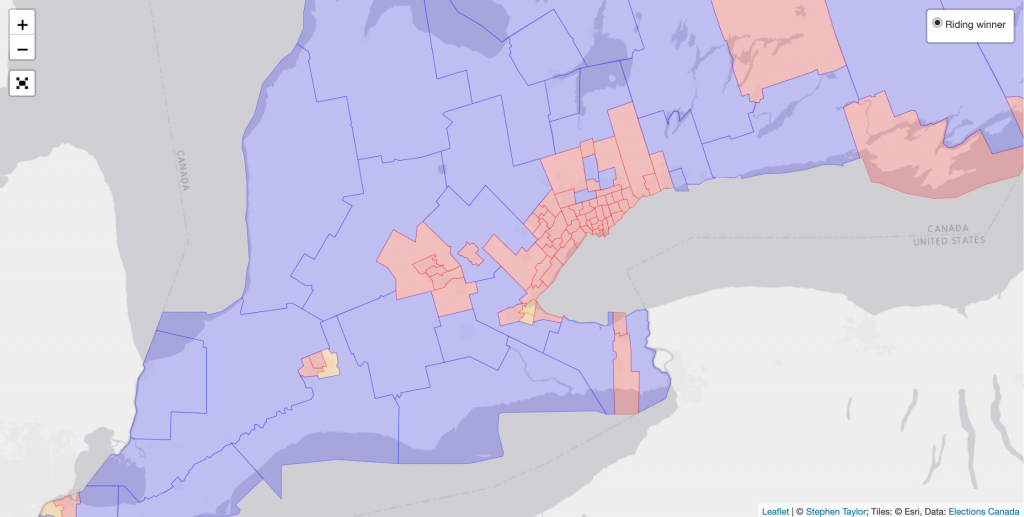 Vote-rich Ontario 2019
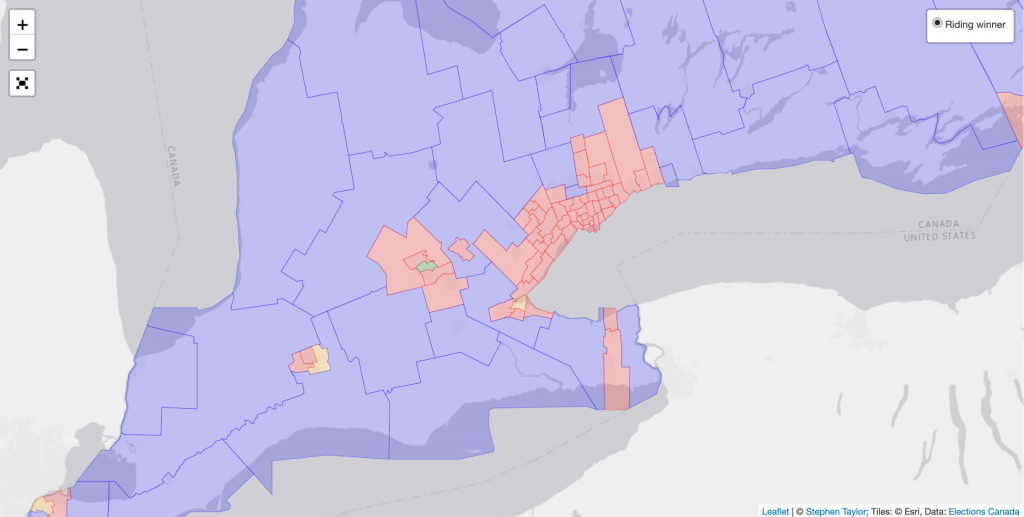 Vote-rich Ontario 2021
The Liberals chipped away at a few urban centres with the Conservatives picking up strength in eastern Canada.
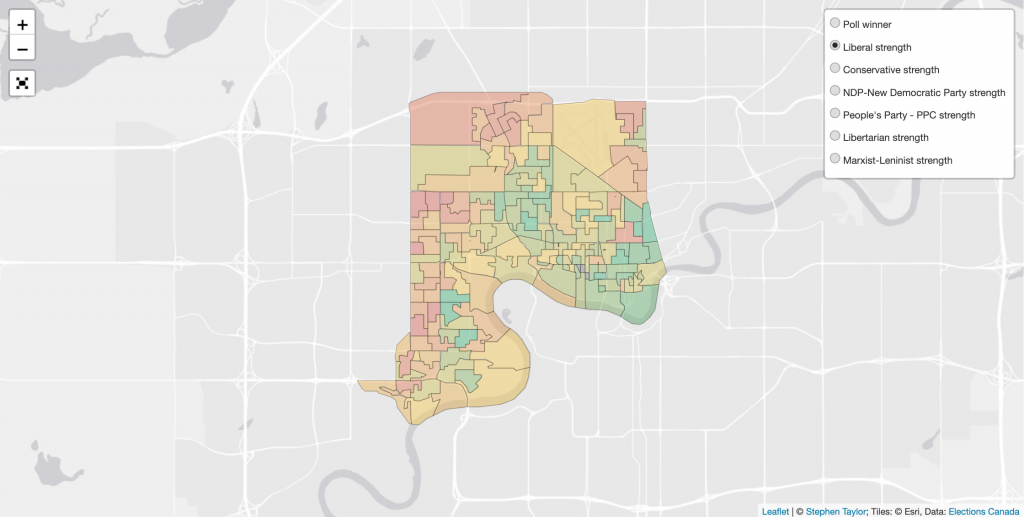 Edmonton Centre votes in 2021. Liberal strength is plotted from green (strong) to red (weak) polls.
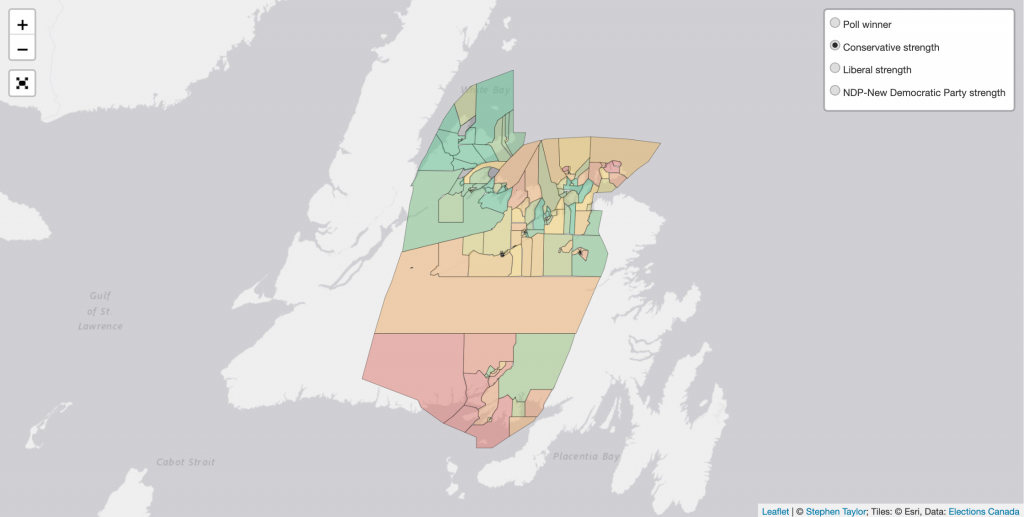 Coast of Bays–Central–Notre Dame was a pickup for the Conservatives in 2021. Scott Simms, the Liberal incumbent was retired after 17 years in office. Conservative strength plotted from green (strong) to red (weak).
There were some peculiarities of note. Take Saint Boniface–Saint Vital in Manitoba, for example. I believe they have the distinction of running the most candidates for office in 2021.
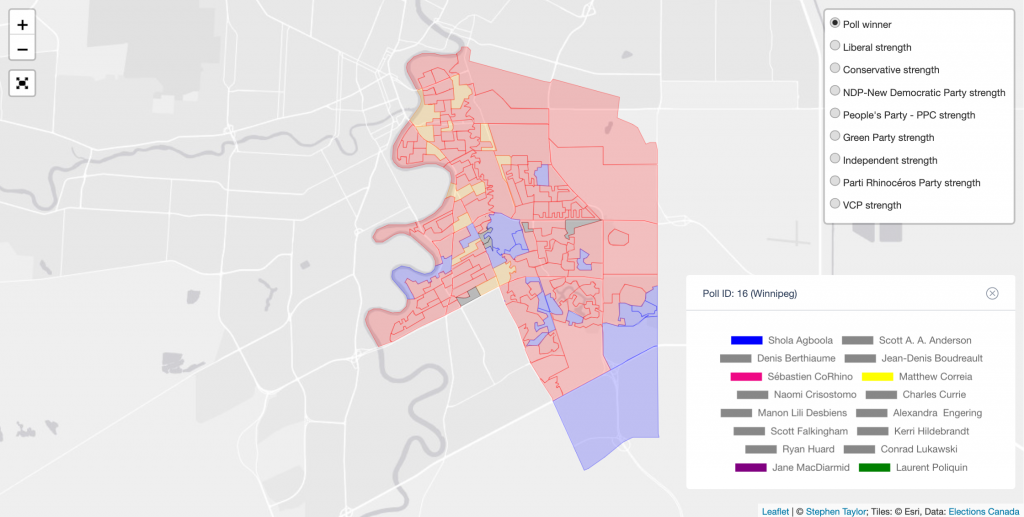 Democracy scenesters or an inside joke?
Since the last election, I’ve added a couple of features that make the mapping tool more interactive. You can search for riding in the search bar above any map. Clicking the “✨ Related content” button at the top right of the screen will show you ridings near the local map you’re looking at, and you can also view the history of the riding at a glance and navigate through last 8 elections. Even if the riding didn’t exist during a previous election, those nearest to the current mapped view will show up along the timeline.
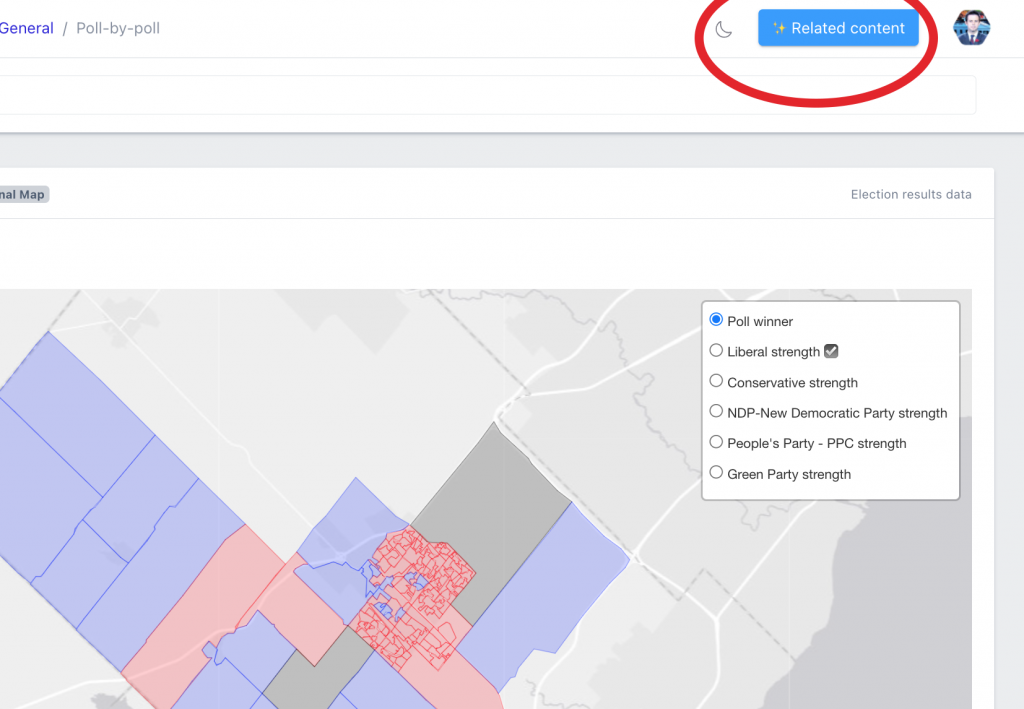 Cliiiick ittt….
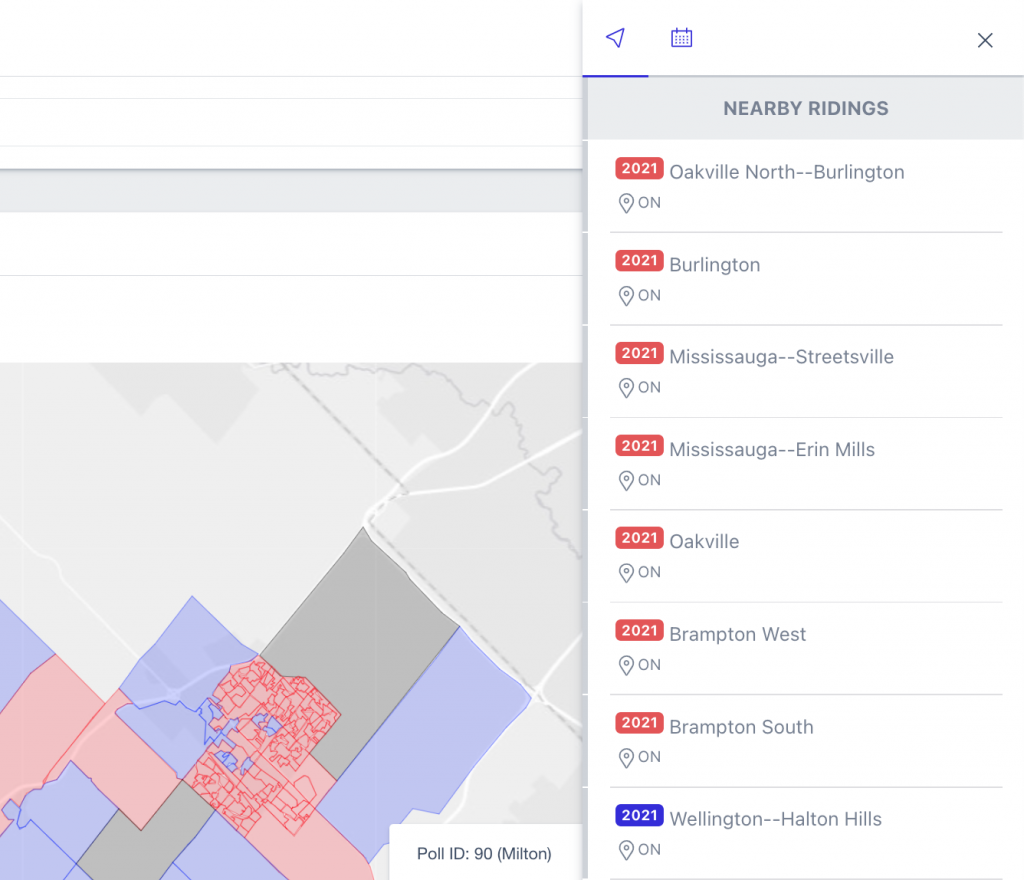 Get that context!
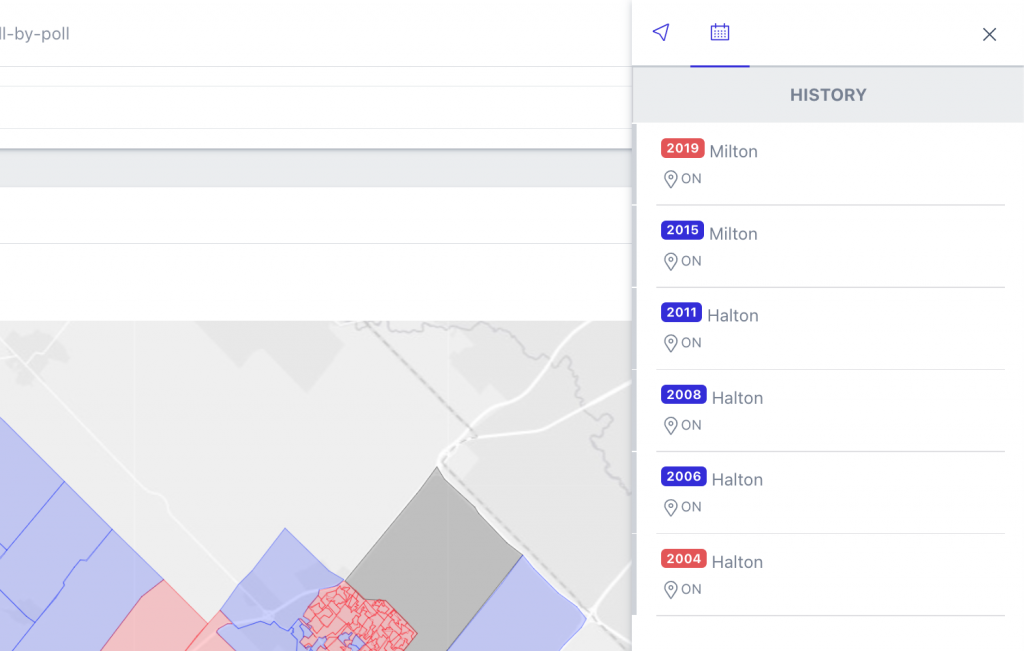 The history of the Milton riding!
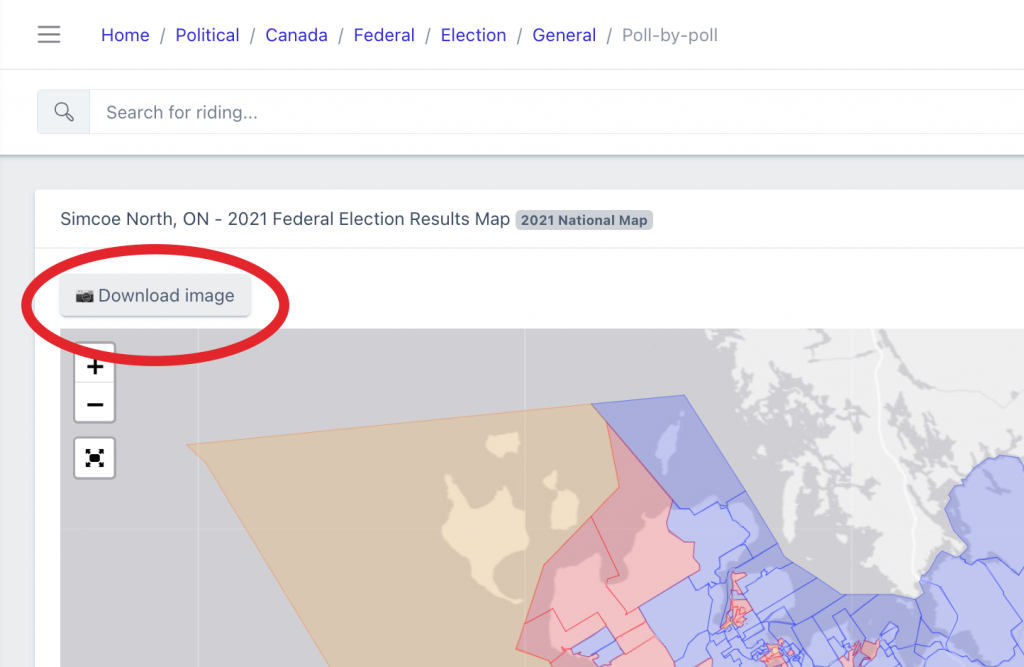
As always, you can size up a map how you like it and click the download image button. Share these maps on Twitter and Instagram. Print them on a t-shirt and wear them proudly to your next family reunion. You’ll be glad you did!
 You’ll be the coolest person on twitter when you download these maps to share.
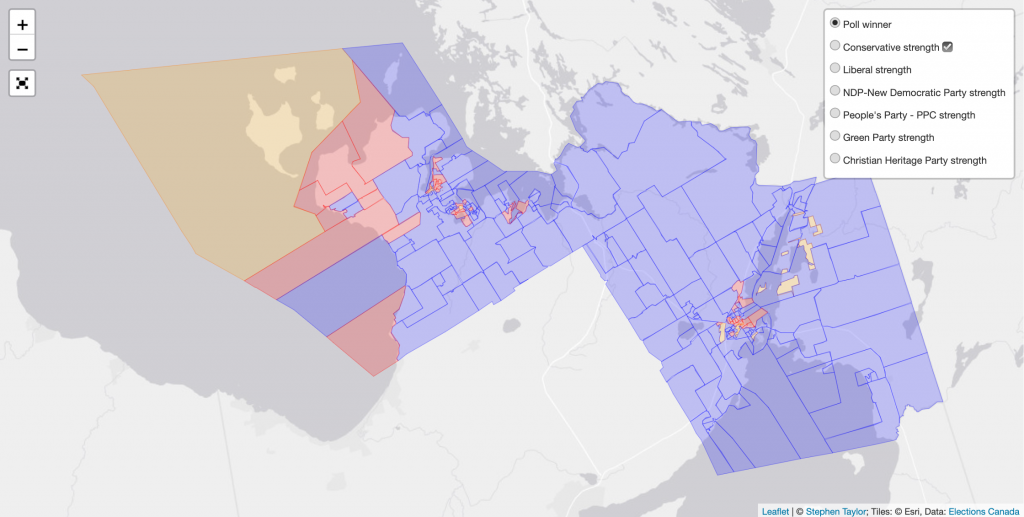 Simcoe North has never looked so good!
I hope you enjoy this project as much I as enjoyed making it. If you have any feature requests, just let me know on twitter @stephen_taylor.
If you want to use the maps on your website, I’d appreciate a link back to my site so that more people can discover the project.
Thanks, and happy exploring!
Related:
The Stephen Taylor Data Project
CPC leadership race mapped out. Where will 2022’s hopefuls look to dominate membership sales?
Related Posts
Canadian federal by-election maps are now on the Data Project
The Stephen Taylor Data Project now includes interactive poll-by-poll maps for every Canadian federal by-election going back to 2005. Multi-agentic AI turned…
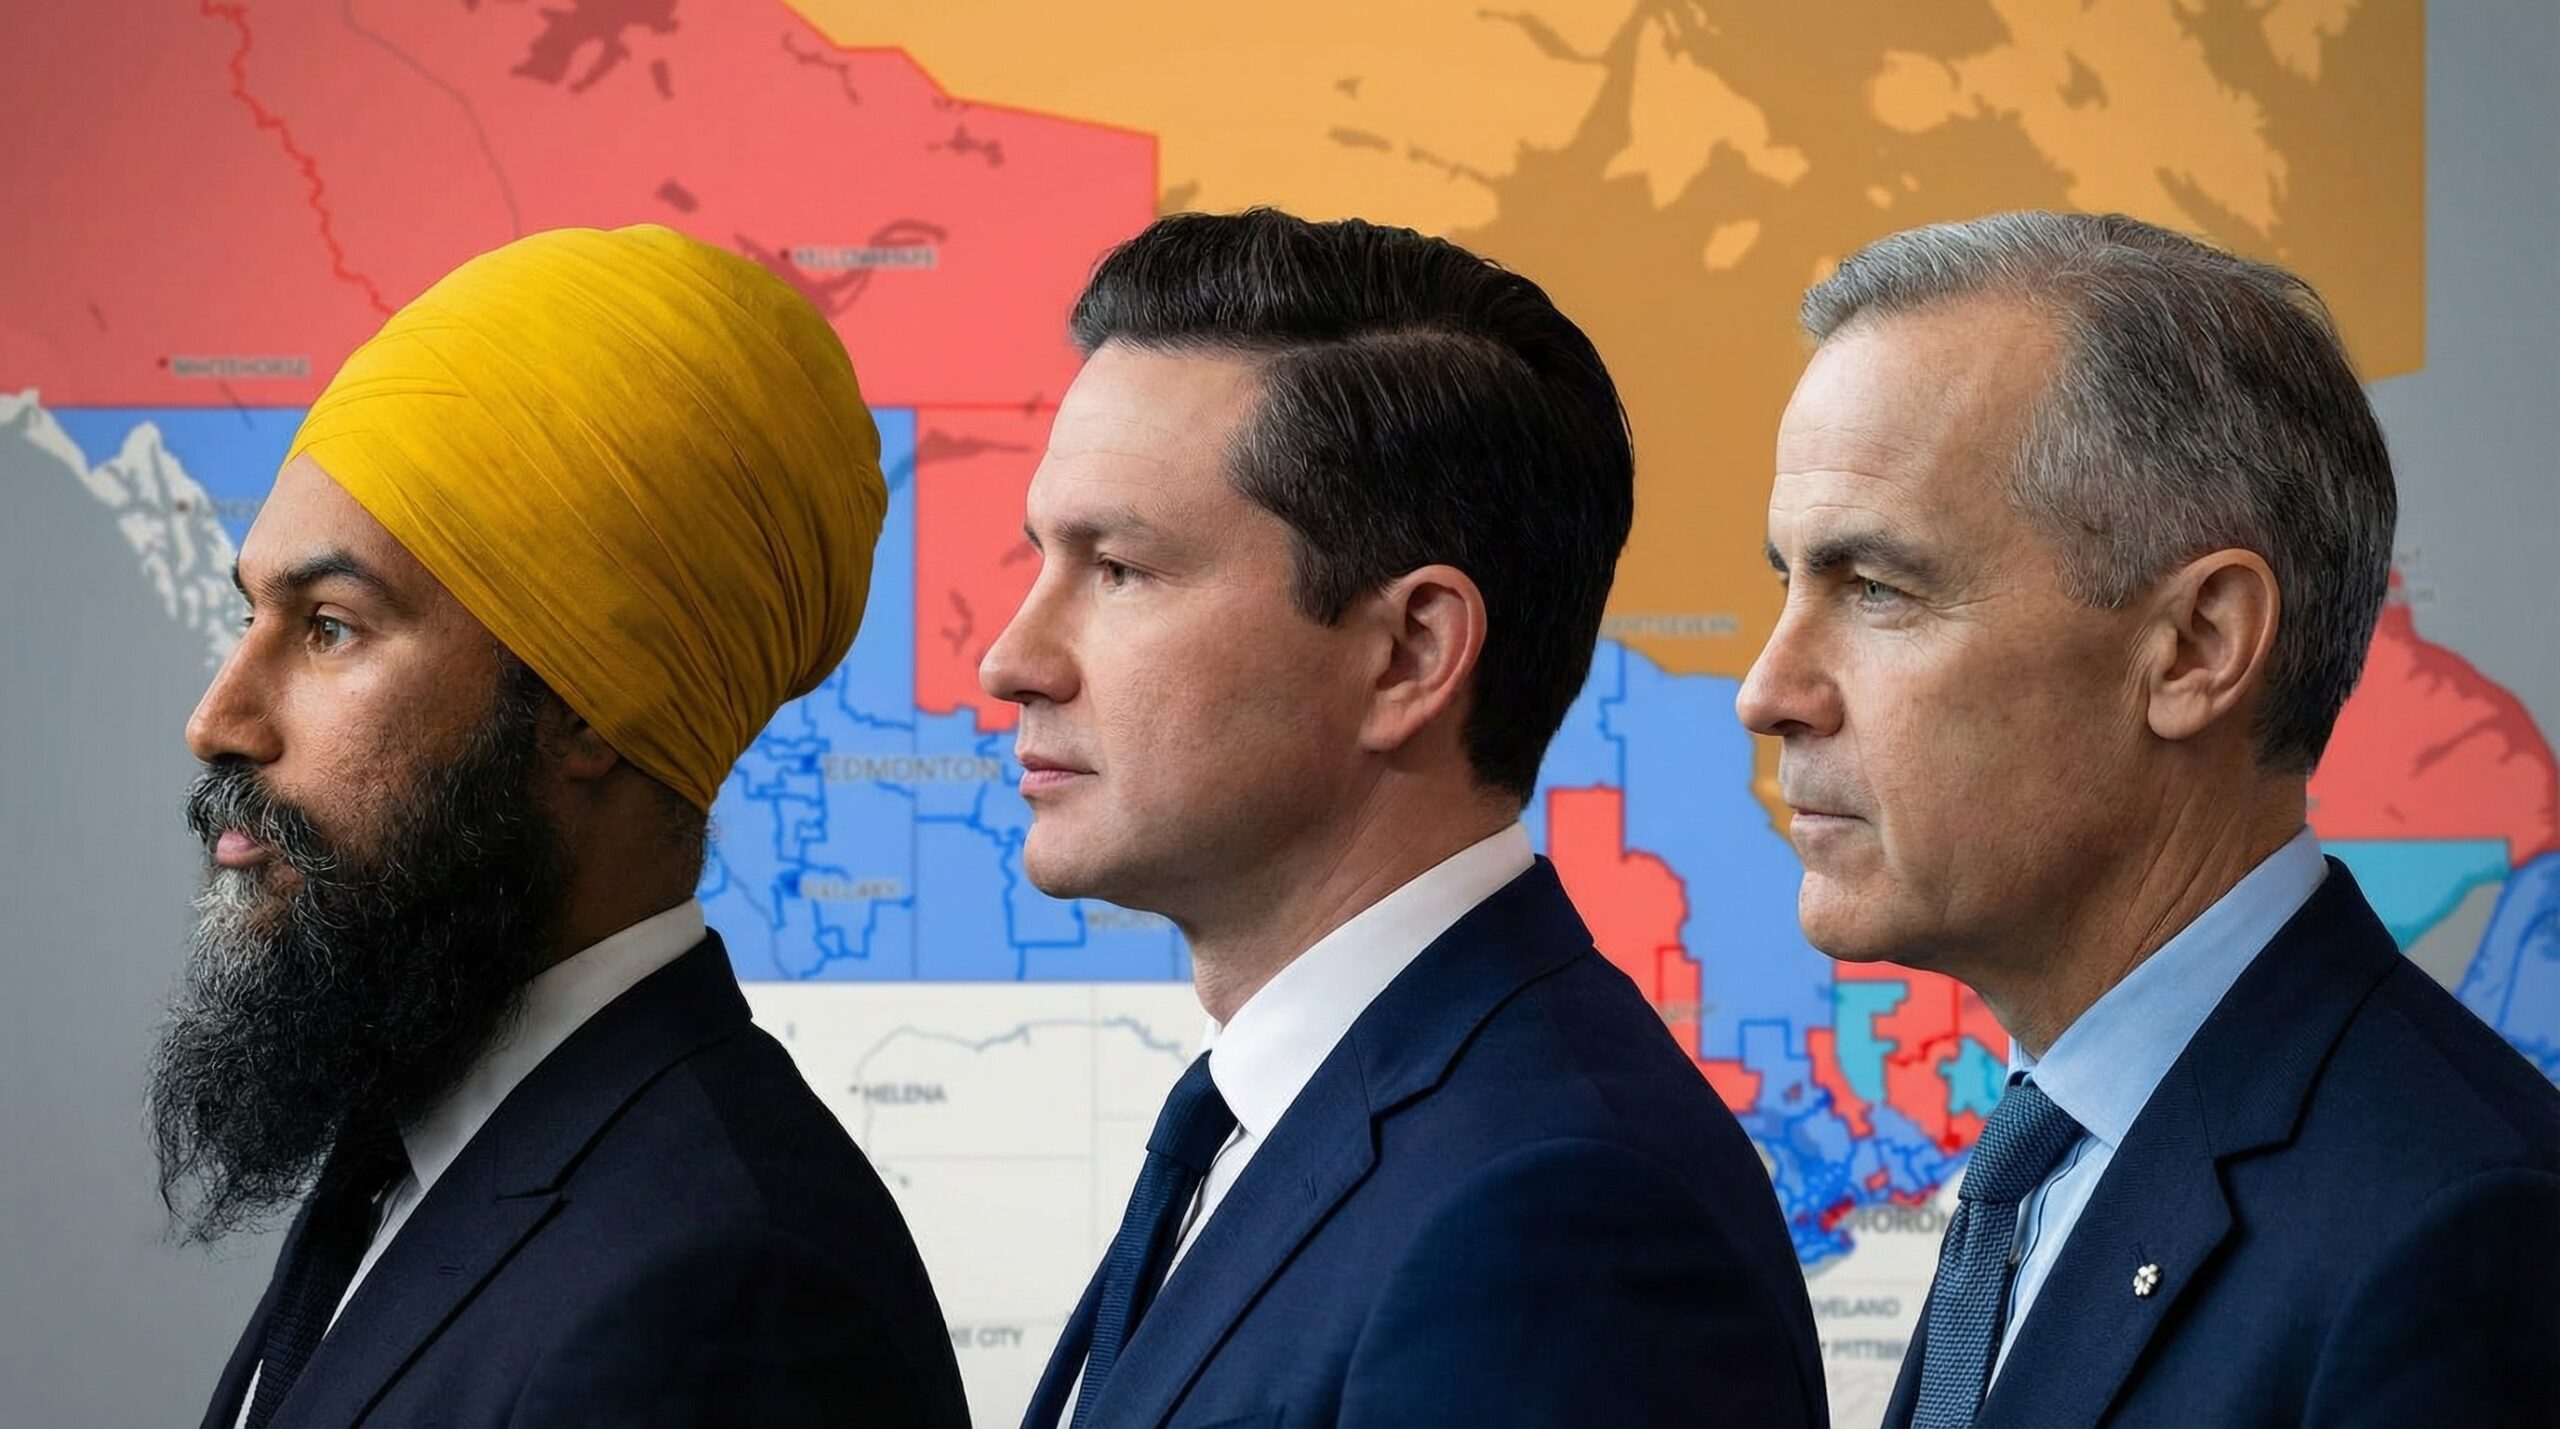
Mapping the results of the 2025 Canadian Federal Election
Yes, it’s finally here. I’ve generated the maps for the 2025 federal election wherein Mark Carney’s Liberal Party elected enough MPs to form a minority…
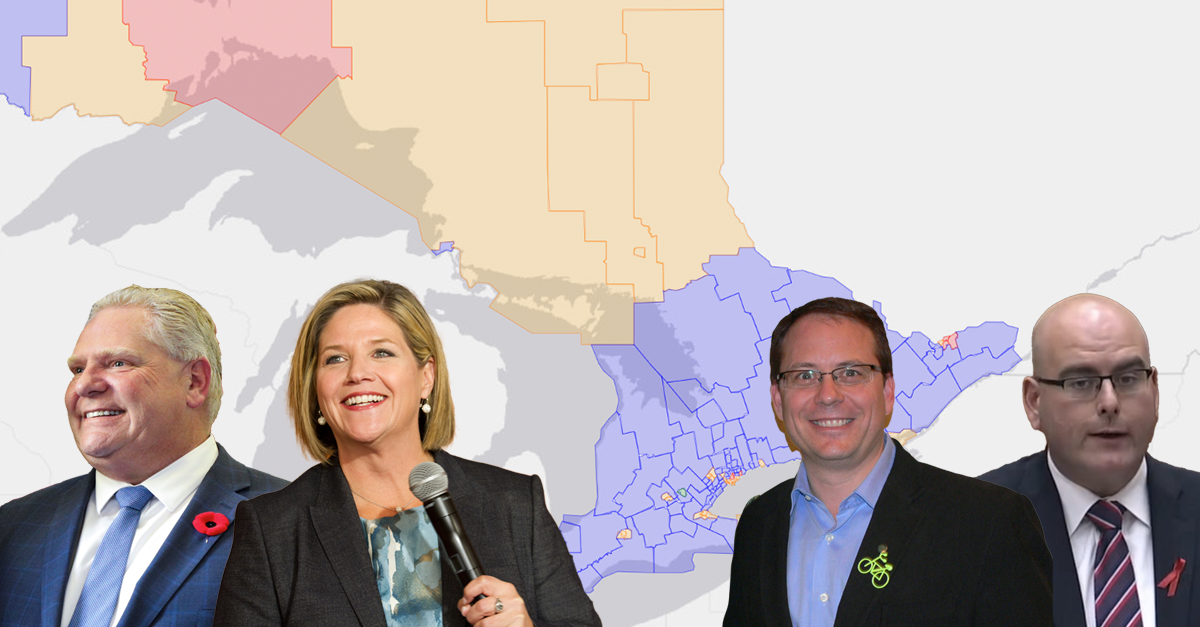
Mapping the results of the 2018 Ontario provincial election
Some of you may be up to more interesting things on the Victoria Day long weekend, but given that we’re into the most important period of a provincial election…