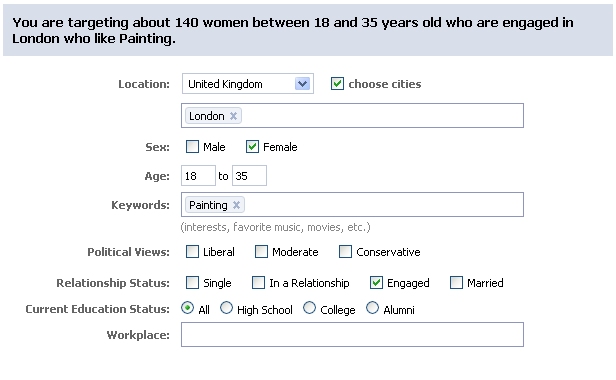
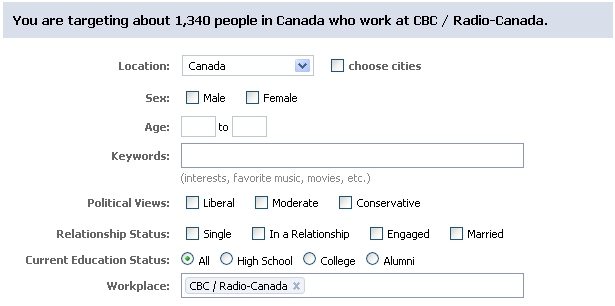
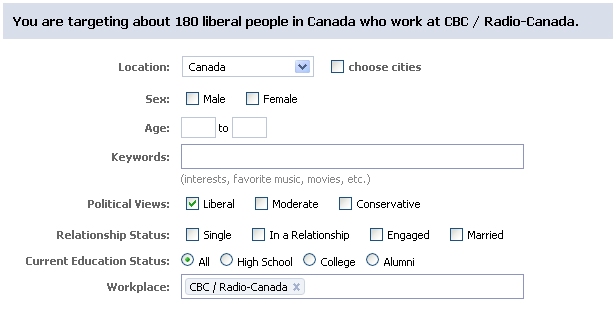
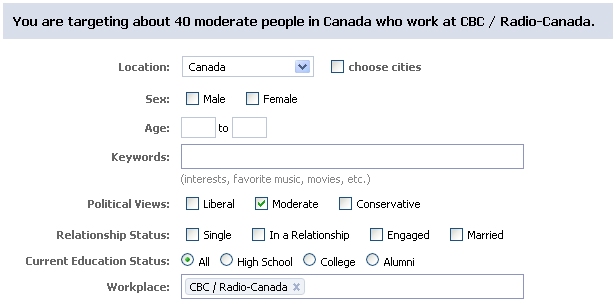
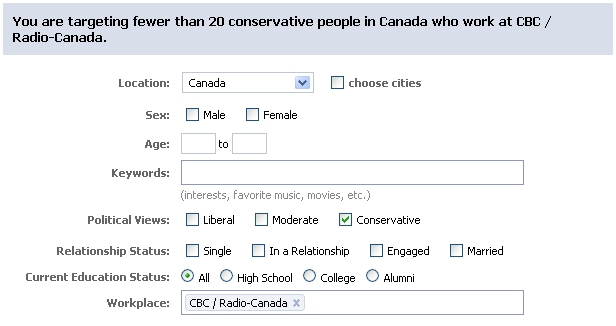
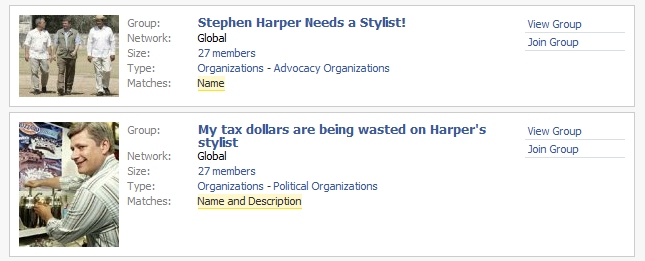
Everybody and their brother knows about Facebook these days. Whether finding old high school classmates, building one’s professional network, or sharing photos among friends, Facebook has many uses to millions of users. There’s a new feature on the website for advertisers that allows the ad buyer the ability of progressively narrowing down a target audience by selecting and excluding demographic data. The side benefit of this is that we can parse Facebook’s user data and get a better understanding of its audience and reach.
Here are the top countries represented on Facebook (users):
1. United States 19,951,900
2. Canada 7,361,720
3. United Kingdom 6,407,580
4. Australia 1,498,320
5. South Africa 605,820
6. France 429,540
7. Norway 891,480
8. Sweden 827,940
9. Mexico 393,940
10. Egypt 376,480
11. Columbia 359,220
12. Turkey 327,760
13. India 287,500
14. Germany 259,760
15. New Zealand 208,000
16. United Arab Emirates 188,600
17. Singapore 180,660
18. Spain 178,900
19. Lebanon 163,720
20. Ireland 131,660
21. Italy 121,000
22. Saudi Arabia 115,980
23. Pakistan 115,240
24. Netherlands 109,840
25. Switzerland 99,600
26. Malaysia 98,060
27. Japan 95,340
28. Israel 94,180
29. China 83,640
30. South Korea 51,080
31. Dominican Republic 33,060
In Canada, the male/female breakdown is:
2,507,620 male
3,431,280 female
The top cities in Canada are:
1,326,280 Toronto
549,600 Montreal
346,020 Vancouver
317,700 Halifax
275,820 Ottawa
186,620 Winnipeg
432,060 Calgary
365,120 Edmonton
In Canada, the political breakdown is:
618,240 Liberal
236,540 Moderate
281,840 Conservative
The male/female breakdown of these figures are (m/f)
282,220/291,300 Liberal
126,360/94,480 Moderate
158,020/104,460 Conservative
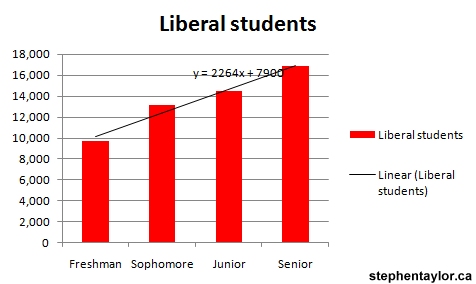
As one goes through college/university in Canada, does one become more or less Liberal or Conservative?
Conservative:
Freshmen 3,420
Sophomores 4,300
Juniors 4,440
Seniors 4,760
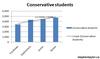
Click to enlarge
Liberal:
9,740 Fresmen
13,160 Sophomores
14,500 Juniors
16,840 Seniors
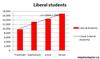
Note the slopes on both graphs. The Conservative graph has a slope of y=416x meaning that as each year goes by, with all else being equal, we can infer that the university experience produces 416 more Conservatives each year of school. Likewise, the slope of the Liberal graph is y=2264x meaning that if our assumptions are the same, we can infer that the university experience produces 2264 more Liberals per year of the undergraduate experience. It would be beneficial to measure the data over four years, but we can hypothesize from this data that universities are having the effect of producing Liberals over Conservatives at 4:1 per year.
(Note that these figures are taken for individuals at the current time, a changing trend is only inferred. All we know for sure is there are more partisans/idelogues in both camps in later years of undergraduate.)
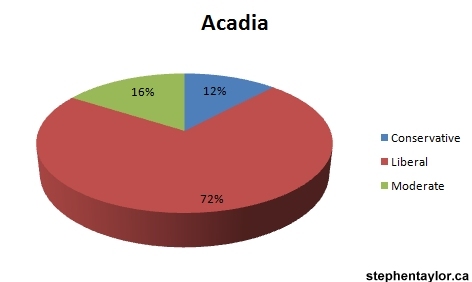
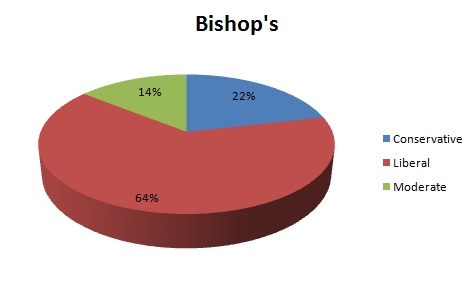
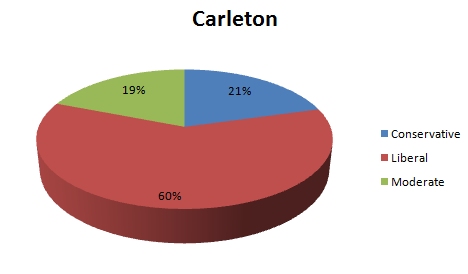
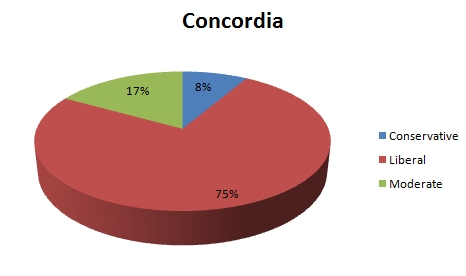
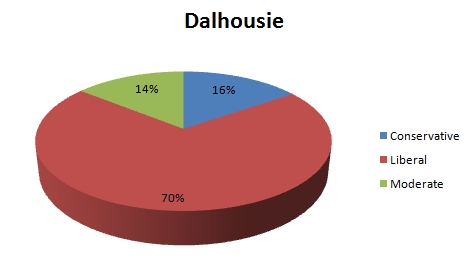
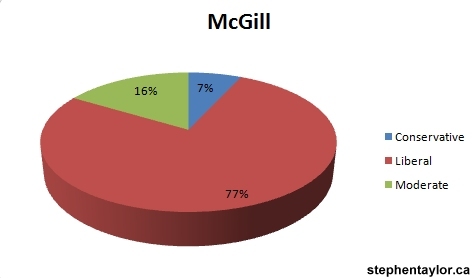
Let’s take a look at how politics breaks down at each Canadian university
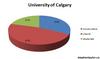
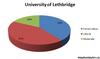
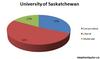
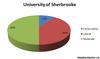
University Liberal/Moderate/Conservative
Acadia 360/80/60

Click to enlarge
Bishop’s 180/40/60

Click to enlarge
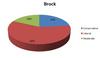
Brock 1,040/320/420
Click to enlarge
Carleton 2,340/740/800

Click to enlarge
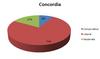
Concordia 1,060/240/120
Click to enlarge
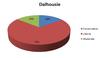
Dalhousie 1,280/260/280
Click to enlarge
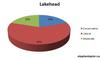
Lakehead 360/120/120
Click to enlarge
Laurentian 440/100/100

Click to enlarge
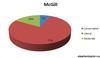
McGill 3,360/720/300
Click to enlarge
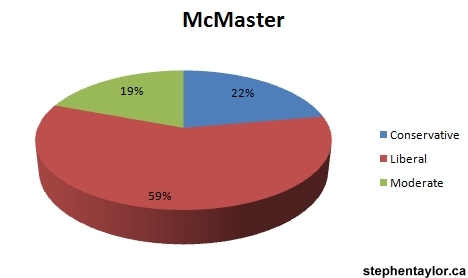
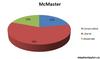
McMaster 2,000/660/760
Click to enlarge
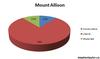
Mount Allison 440/60/60
Click to enlarge
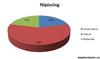
Nipissing 220/80/80
Click to enlarge
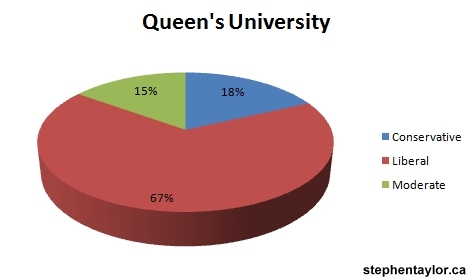
Queen’s University 2,220/500/600

Click to enlarge
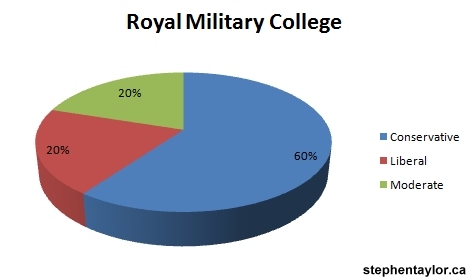
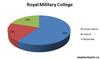
Royal Military College 60/60/180
Click to enlarge
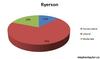
Ryerson 2,020/560/360
Click to enlarge
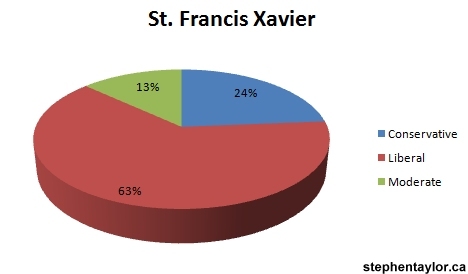
St. Francis Xavier 480/100/180

Click to enlarge
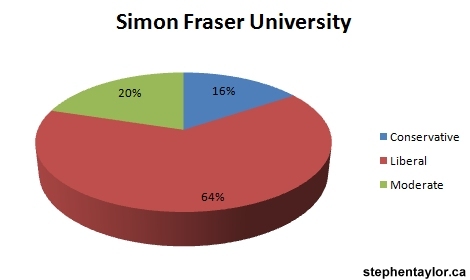
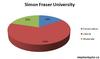
Simon Fraser University 1,400/440/340
Click to enlarge
Trent 800/160/180

Click to enlarge
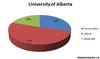
University of Alberta 2,340/900/1,340
Click to enlarge
University of British Columbia 3,120/920/620

Click to enlarge
University of Calgary 1,220/540/840
Click to enlarge
University of Guelph 2,060/460/500

Click to enlarge
University of Lethbridge 480/200/440
Click to enlarge
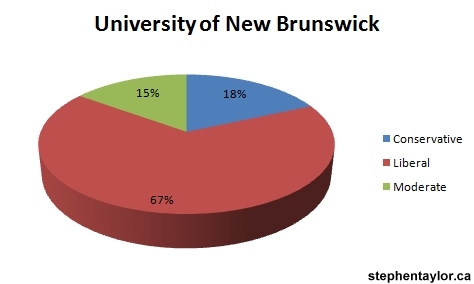
University of New Brunswick 800/180/220

Click to enlarge
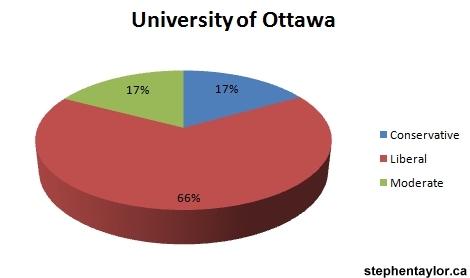
University of Ottawa 2,440/640/620

Click to enlarge
U Regina 220/40/80

Click to enlarge
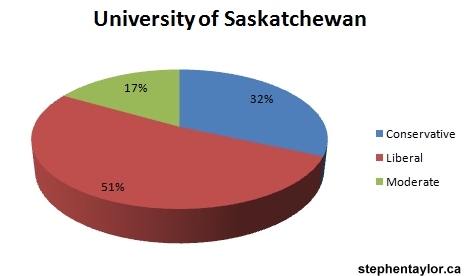
University of Saskatchewan 620/200/380
Click to enlarge
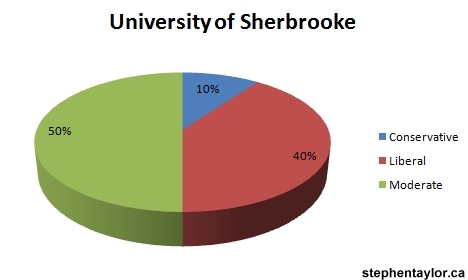
University of Sherbrooke 80/100/20* (* fewer than 20)
Click to enlarge
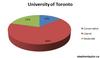
University of Toronto 5,560/1,740/1,140
Click to enlarge
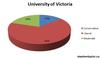
University of Victoria 1,300/400/280
Click to enlarge
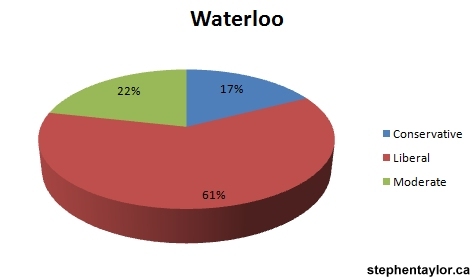
University of Waterloo 2,380/840/680

Click to enlarge
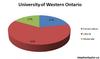
University of Western Ontario 2,820/760/980
Click to enlarge
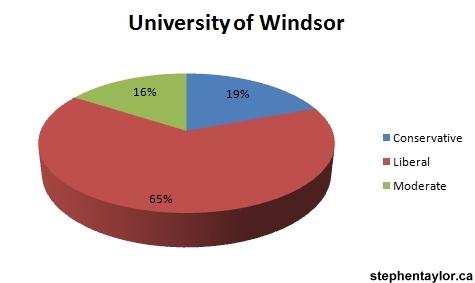
University of Windsor 1,140/280/340

Click to enlarge
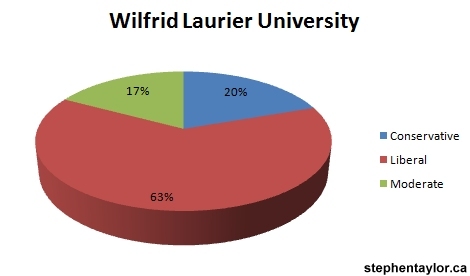
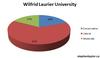
Wilfrid Laurier University 1,540/420/480
Click to enlarge
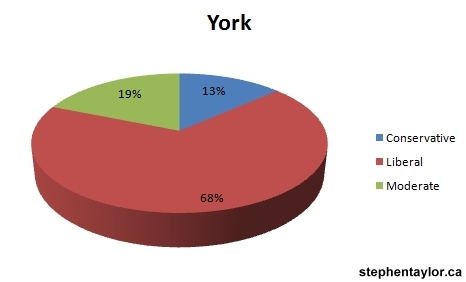
York University 3,520/980/700

Click to enlarge
As for the ratio of Liberal students:Conservative students?
Here are the top five (the most Liberal schools in the country by this measure):
McGill 11.2:1
Concordia 8.8:1
Mount Allison 7.3:1
Acadia 6:1
Ryerson 5.6:1
And the bottom five (the most Conservative schools in the country by this measure):
Royal Military College 0.33:1
University of Lethbridge 1.1:1
University of Calgary 1.5:1
University of Saskatchewan 1.6:1
University of Alberta 1.7:1
A bit more about the methodology:
This data was taken from this Facebook page on October 17th, 2007. All data is self-declared by individuals with Facebook profiles.
UPDATE: It appears that Facebook has disabled the feature.