Mapping the results of the 2025 Canadian Federal Election

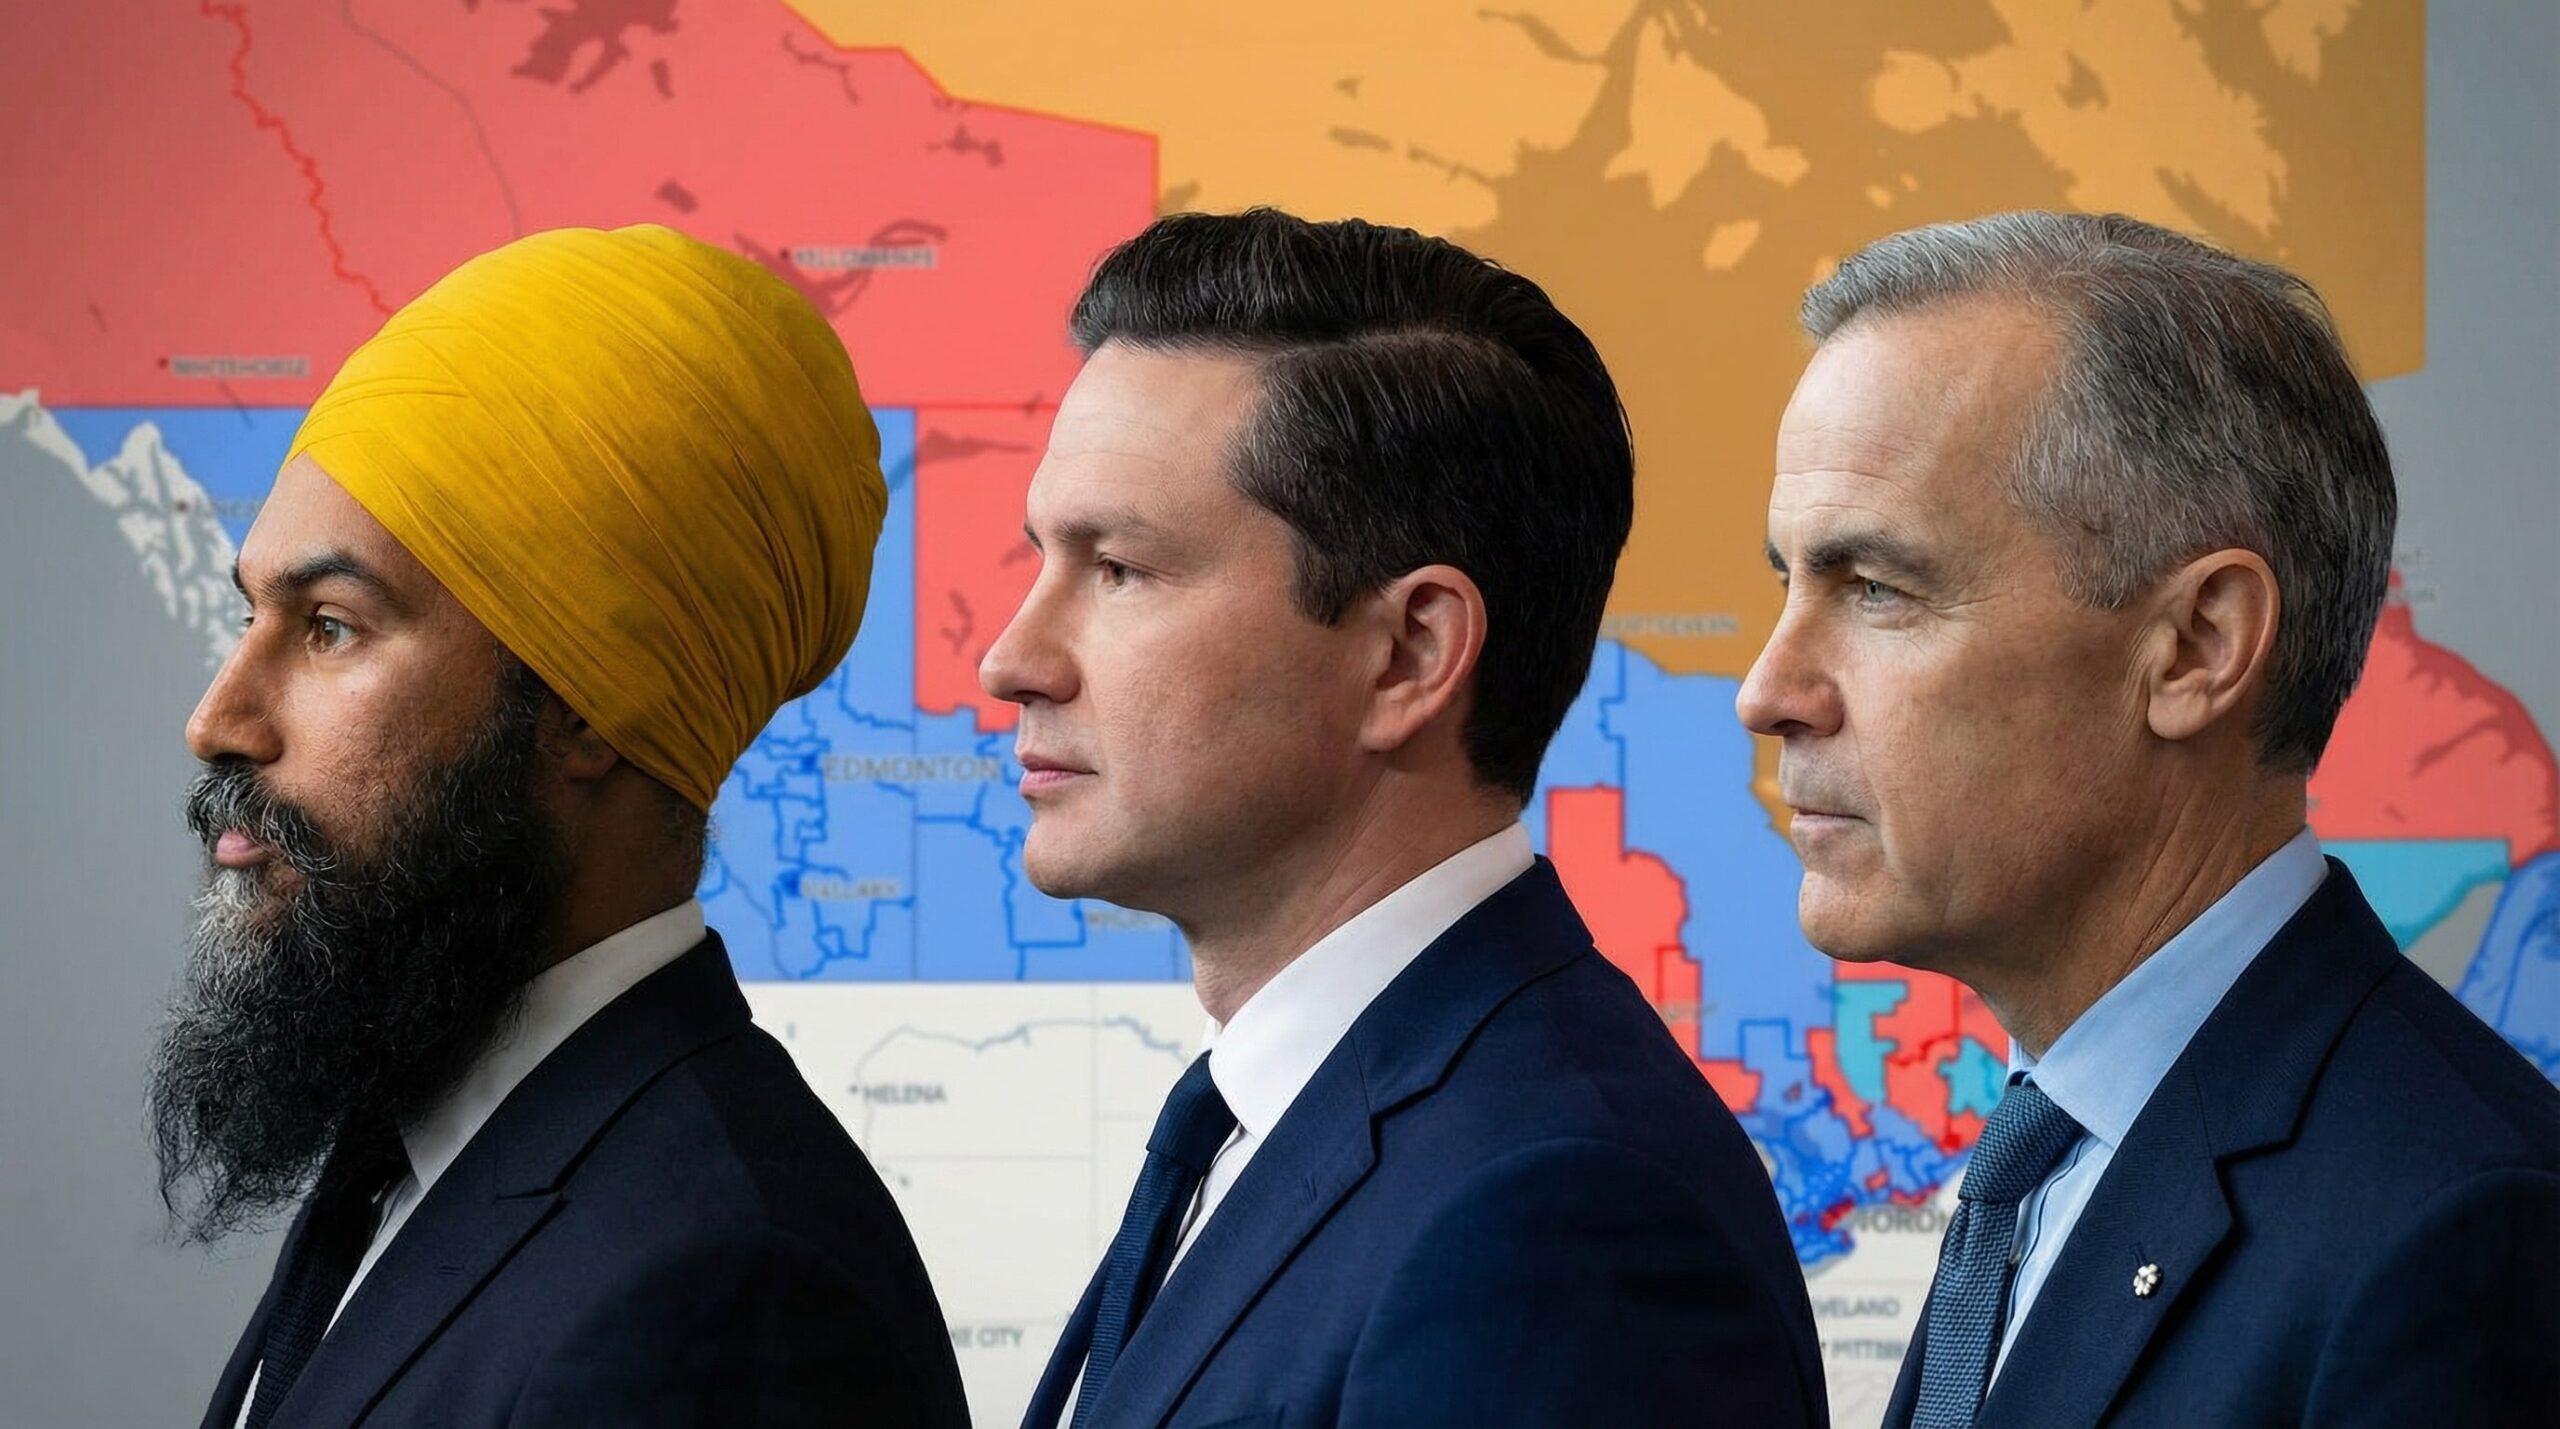
Yes, it’s finally here. I’ve generated the maps for the 2025 federal election wherein Mark Carney’s Liberal Party elected enough MPs to form a minority Parliament defeating Pierre Poilievre’s Conservatives in a stunning upset that was precipitated by Trump tariffs and the sudden departure of Justin Trudeau from Liberal leadership and the Prime Minister’s Office.

This resource has the national, riding, and polling-level results and is highly interactive and educational. Wow!

Canada: economically depressed but elbows up
2025 Canadian General election results – National map

It’s no small task assembling spreadsheet data for 343 ridings and tens of thousands of polling divisions from Elections Canada with GIS data from Natural Resources Canada. Over the years, I’ve written quite a few NodeJS scripts and assembled quite a database which has survived the move between computers, cities, and cloud companies.

Enter the new era of AI.

Adapting old scripts to new data (and new ridings) was made into a task of hours instead of days in order to produce our maps. So please be my guest! Take a look at the vector maps that defined the 2025 Canadian federal election. Zoom in to a riding map to reveal poll-by-poll resolution to find out how your neighbours voted, or appreciate the gradients of partisan support that exist across economically diverse electoral districts.

My blog’s been a bit sleepy for a few years now and every once and a while I check in on what people are searching in order to arrive at stephentaylor.ca. The maps have certainly taken over long-tail search. There are 343 ridings now, after all.

Let’s take a closer look.

Mark Carney formed government winning 169 seats, falling just short of a majority government. He contested and won the riding of Nepean.

Nepean - 2025 Candian General Election
Nepean election results – 2025 Candian General Election

Next door in Carleton, Pierre Poilievre suffered a loss of his own riding that he had held for over 20 years.

Carelton results - 2025 Canadian General Election
Carelton election results – 2025 Canadian General Election

Though managing to increase the Conservative seat total in the 2025 Canadian general election to 144 seats, this long was particularly painful on election night. Poilievre would later go on and contest Battle-River–Crowfoot after the Conservative victor on election night, Damien Kurek, stepped aside for the party boss.

Battle River—Crowfoot results - 2025 Canadian General Election
Battle River—Crowfoot election results – 2025 Canadian General Election

Poilievre wasn’t the only federal leader to lose their seat on election night. NDP leader Jagmeet Singh led his party to its worse result since the party’s founding in 1961.

Until I took a closer look when writing this post, I hadn’t realized he’d lost every poll in his riding of Burnaby Central except for one.

Burnaby Central results - 2025 Canadian General Election
Burnaby Central election results – 2025 Canadian General Election

Justin Trudeau was a deeply unpopular leader who was propped up by Singh’s party who feared a profound election defeat. It turned out that when Trudeau left, Singh was left representing the era he helped defined – and Canadians punished the NDP. Historians will note that Singh didn’t just lose votes to the Liberals but a large chunk of his coalition voted Conservative in 2025. Indeed, parts of Windsor – like Windsor West – went blue for the first time.

Windsor West results - 2025 Candian General Election
Windsor West election results – 2025 Candian General Election

Conservatives predict that we’ll be into an election again soon enough. Carney will want to take advantage of a Conservative Party that is doing some soul-searching and feet-finding while the Trump uncertainty still exists over tariffs and the broader economy. Carney also sees himself as the international deal-maker. Those deals have yet to come to fruition but setting his travel schedule according to the Parliamentary and his government’s razor thin advantage there is going to get old soon for him if it hasn’t already.

Damien Kurek resigns so Pierre Poilievre can lead

Battle River–Crowfoot MP Damien Kurek officially resigned from Parliament today. The move will trigger a by-election for the riding where Pierre Poilievre will throw his hat into the ring in order to secure a seat in the the House of Commons.

Damien Kurek and Pierre Poilievre

Despite growing the Conservative seat count and the party’s popular vote, the Conservative leader lost his own seat to Liberal Bruce Fanjoy in the riding of Carleton. Poilievre had held the Ottawa region seat for 21 years.

Battle River–Crowfoot is a rural Alberta riding which occupies the space East of Highway 2 between Calgary and Edmonton. Poilievre volunteers have already started door knocking in the riding in anticipation of a by-election to be called within six months. For his part, Prime Minister Mark Carney has indicated that a by-election will happen sooner rather than later.

Former Conservative leader Andrew Scheer taken up leadership duties in Parliament while Poilievre maintains his status as leader of the Conservative Party of Canada.

Poilievre will face a leadership review likely in January of 2026 at the upcoming Conservative policy convention. Poilievre still enjoys widespread support within the party.

The collapse of Jagmeet Singh‘s NDP and the agitation of US President Donald Trump to remove Justin Trudeau and then install Mark Carney over a kayfabe fight on trade and sovereigty proved to be catastrophic for a Conservative Party that was on its way to forming a majority government just months ago.

So, Damien Kurek steps into the role of ‘good guy’ and steps aside so Pierre Poilievre can take his seat in the Commons. Perhaps we’ll be calling him Senator Kurek some day?

Facebook statistics

Everybody and their brother knows about Facebook these days. Whether finding old high school classmates, building one’s professional network, or sharing photos among friends, Facebook has many uses to millions of users. There’s a new feature on the website for advertisers that allows the ad buyer the ability of progressively narrowing down a target audience by selecting and excluding demographic data. The side benefit of this is that we can parse Facebook’s user data and get a better understanding of its audience and reach.

Here are the top countries represented on Facebook (users):
1. United States 19,951,900
2. Canada 7,361,720
3. United Kingdom 6,407,580
4. Australia 1,498,320
5. South Africa 605,820
6. France 429,540
7. Norway 891,480
8. Sweden 827,940
9. Mexico 393,940
10. Egypt 376,480
11. Columbia 359,220
12. Turkey 327,760
13. India 287,500
14. Germany 259,760
15. New Zealand 208,000
16. United Arab Emirates 188,600
17. Singapore 180,660
18. Spain 178,900
19. Lebanon 163,720
20. Ireland 131,660
21. Italy 121,000
22. Saudi Arabia 115,980
23. Pakistan 115,240
24. Netherlands 109,840
25. Switzerland 99,600
26. Malaysia 98,060
27. Japan 95,340
28. Israel 94,180
29. China 83,640
30. South Korea 51,080
31. Dominican Republic 33,060

In Canada, the male/female breakdown is:
2,507,620 male
3,431,280 female

The top cities in Canada are:
1,326,280 Toronto
549,600 Montreal
346,020 Vancouver
317,700 Halifax
275,820 Ottawa
186,620 Winnipeg
432,060 Calgary
365,120 Edmonton

In Canada, the political breakdown is:
618,240 Liberal
236,540 Moderate
281,840 Conservative

The male/female breakdown of these figures are (m/f)
282,220/291,300 Liberal
126,360/94,480 Moderate
158,020/104,460 Conservative

As one goes through college/university in Canada, does one become more or less Liberal or Conservative?
Conservative:
Freshmen 3,420
Sophomores 4,300
Juniors 4,440
Seniors 4,760

conservativesovertime.jpg
Click to enlarge

Liberal:
9,740 Fresmen
13,160 Sophomores
14,500 Juniors
16,840 Seniors

liberalsovertime.jpg

Note the slopes on both graphs. The Conservative graph has a slope of y=416x meaning that as each year goes by, with all else being equal, we can infer that the university experience produces 416 more Conservatives each year of school. Likewise, the slope of the Liberal graph is y=2264x meaning that if our assumptions are the same, we can infer that the university experience produces 2264 more Liberals per year of the undergraduate experience. It would be beneficial to measure the data over four years, but we can hypothesize from this data that universities are having the effect of producing Liberals over Conservatives at 4:1 per year.

(Note that these figures are taken for individuals at the current time, a changing trend is only inferred. All we know for sure is there are more partisans/idelogues in both camps in later years of undergraduate.)

Let’s take a look at how politics breaks down at each Canadian university
University Liberal/Moderate/Conservative
Acadia 360/80/60

acadia-graph.jpg
Click to enlarge

Bishop’s 180/40/60

bishops-graph.jpg
Click to enlarge

Brock 1,040/320/420

brock-graph.jpg
Click to enlarge

Carleton 2,340/740/800

carleton-graph.jpg
Click to enlarge

Concordia 1,060/240/120

concordia-graph.jpg
Click to enlarge

Dalhousie 1,280/260/280

dalhousie-graph.jpg
Click to enlarge

Lakehead 360/120/120

lakehead-graph.jpg
Click to enlarge

Laurentian 440/100/100

laurentian-graph.jpg
Click to enlarge

McGill 3,360/720/300

mcgill-graph.jpg
Click to enlarge

McMaster 2,000/660/760

mcmaster-graph.jpg
Click to enlarge

Mount Allison 440/60/60

mounta-graph.jpg
Click to enlarge

Nipissing 220/80/80

nipissing-graph.jpg
Click to enlarge

Queen’s University 2,220/500/600

queensu-graph.jpg
Click to enlarge

Royal Military College 60/60/180

rmc-graph.jpg
Click to enlarge

Ryerson 2,020/560/360

ryerson-graph.jpg
Click to enlarge

St. Francis Xavier 480/100/180

stfx-graph.jpg
Click to enlarge

Simon Fraser University 1,400/440/340

sfu-graph.jpg
Click to enlarge

Trent 800/160/180

trent-graph.jpg
Click to enlarge

University of Alberta 2,340/900/1,340

ualberta-graph.jpg
Click to enlarge

University of British Columbia 3,120/920/620

ubc-graph.jpg
Click to enlarge

University of Calgary 1,220/540/840

ucalgary-graph.jpg
Click to enlarge

University of Guelph 2,060/460/500

uguelph-graph.jpg
Click to enlarge

University of Lethbridge 480/200/440

ulethbridge-graph.jpg
Click to enlarge

University of New Brunswick 800/180/220

unb-graph.jpg
Click to enlarge

University of Ottawa 2,440/640/620

uottawa-graph.jpg
Click to enlarge

U Regina 220/40/80

uregina-graph.jpg
Click to enlarge

University of Saskatchewan 620/200/380

usask-graph.jpg
Click to enlarge

University of Sherbrooke 80/100/20* (* fewer than 20)

usherbrooke-graph.jpg
Click to enlarge

University of Toronto 5,560/1,740/1,140

uoft-graph.jpg
Click to enlarge

University of Victoria 1,300/400/280

uvic-graph.jpg
Click to enlarge

University of Waterloo 2,380/840/680

waterloo-graph.jpg
Click to enlarge

University of Western Ontario 2,820/760/980

uwo-graph.jpg
Click to enlarge

University of Windsor 1,140/280/340

uwindsor-graph.jpg
Click to enlarge

Wilfrid Laurier University 1,540/420/480

wlu-graph.jpg
Click to enlarge

York University 3,520/980/700

york-graph.jpg
Click to enlarge

As for the ratio of Liberal students:Conservative students?
Here are the top five (the most Liberal schools in the country by this measure):
McGill 11.2:1
Concordia 8.8:1
Mount Allison 7.3:1
Acadia 6:1
Ryerson 5.6:1

And the bottom five (the most Conservative schools in the country by this measure):
Royal Military College 0.33:1
University of Lethbridge 1.1:1
University of Calgary 1.5:1
University of Saskatchewan 1.6:1
University of Alberta 1.7:1

A bit more about the methodology:
This data was taken from this Facebook page on October 17th, 2007. All data is self-declared by individuals with Facebook profiles.

UPDATE: It appears that Facebook has disabled the feature.