Commissioner of Canada Elections is flooded with complaints

The Commissioner of Canada Elections has released statistics about complaints received during the 45th general election, which saw Mark Carney’s Liberal party elected as to a minority government.

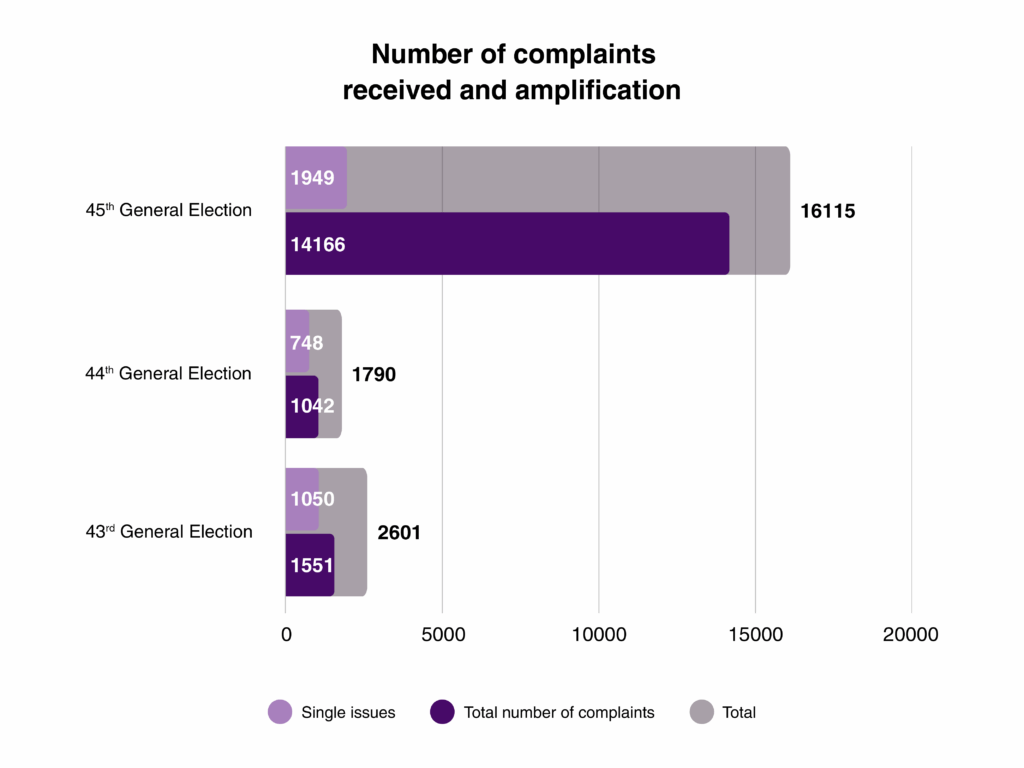
The office responsible for ensuring compliance with and enforcement of the Canada Elections Act received 700% more complaints than in the previous election. That’s 650 complaints per hour during the campaign!

Canadians filed 16,115 grievances with the office. These ranged from allegations of foreign interference to reports of unauthorized election advertising, voters posting images of their ballots on social media, and failures by third-party advertisers to register. Third-party advertisers are allowed to promote during elections but must first file the proper forms with Elections Canada.

Amusingly—and perhaps predictably—the vast majority of complaints reviewed so far have been deemed out of scope for the Commissioner. That’s a more technical way of saying the complainants didn’t have a case.

Due to the high volume, most complaints remain unprocessed. As of June 25, the office had only reviewed 2,330 of the 16,115 complaints.

The Commissioner noted that many complaints were the result of a general ignorance of the law.

As an interesting aside, the office had expected far more complaints related to artificial intelligence and disinformation, but such concerns turned out to be overblown in the lead-up to the election.

In case you were worried: so far, the Commissioner has found no evidence that any of the complaints processed to date had an effect on the final results of the election.

Mapped Results of the 2021 Canadian Federal Election

Elections Canada has just released the official results of 2021 Canadian federal election.

The official voting results present the results of the election in much greater detail than the validated results that were shared immediately after the election. While the results themselves do not change, the official voting results provide more context by combining multiple data sources—including updated data on the number of registered electors, demographic information on candidates and poll-by-poll results—and presenting the data as a complete package, shared in multiple formats.

Elections Canada

This detailed CSV files of these results were released on April 7th and include the poll-by-poll tallies of the 338 ridings. Those polls are neighbourhood-sized slices of Canada of under 1000 electors (some neighbourhoods are bigger depending on the geography, of course). There are, by my count, 69997 polling divisions in Canada.

As I do, I stayed up all night to crunch through the data and plot it in map format. This, because I know you prefer not to consume your elections data via spreadsheet.

You can dive in by starting at the national map and clicking on any riding of your choosing.

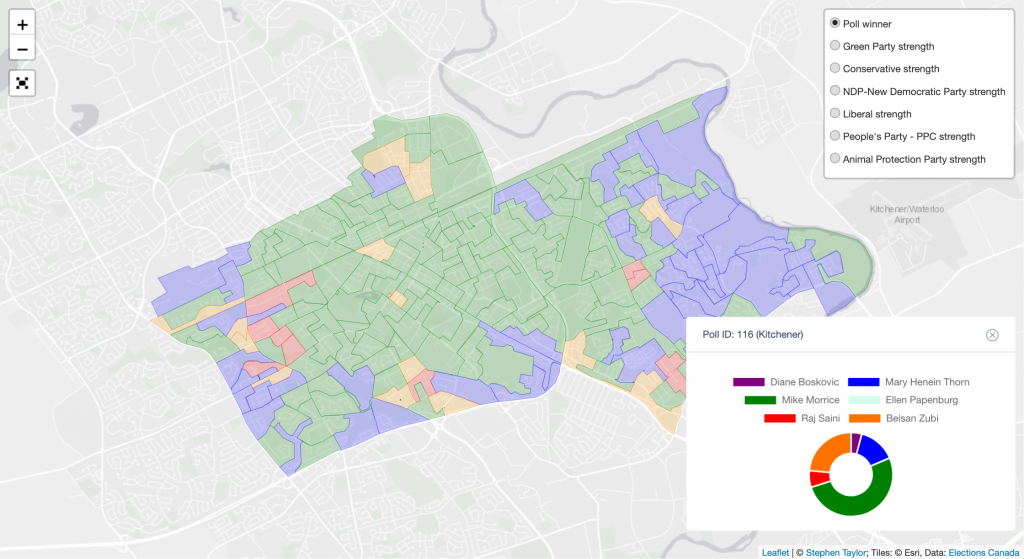
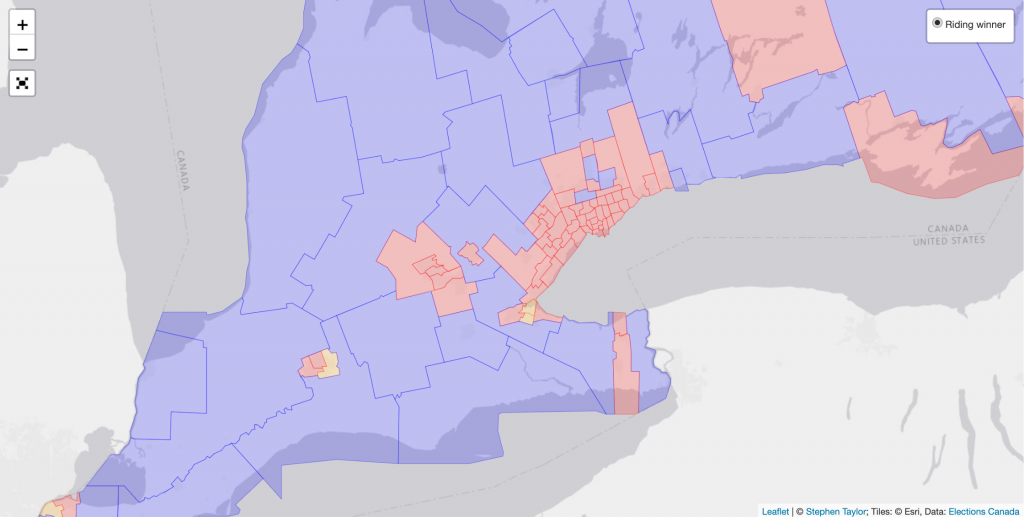
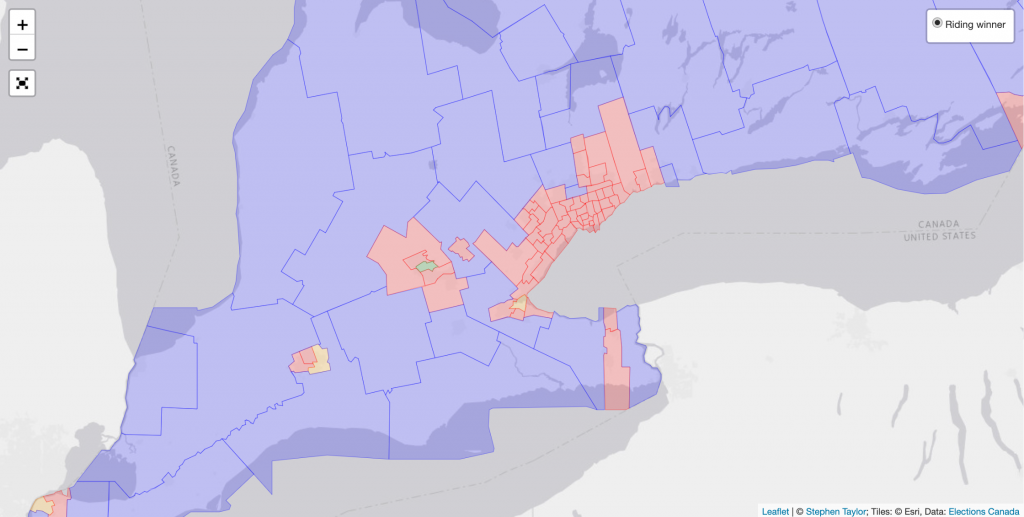
Kitchener Centre was picked up by the Green Party

It’s still early so I haven’t done too much analysis on these maps yet (please tell me what you discover!)

As we all know, Justin Trudeau was held to a minority government with no significant change in the seats between the Liberals and Conservative parties.

The Liberals chipped away at a few urban centres with the Conservatives picking up strength in eastern Canada.

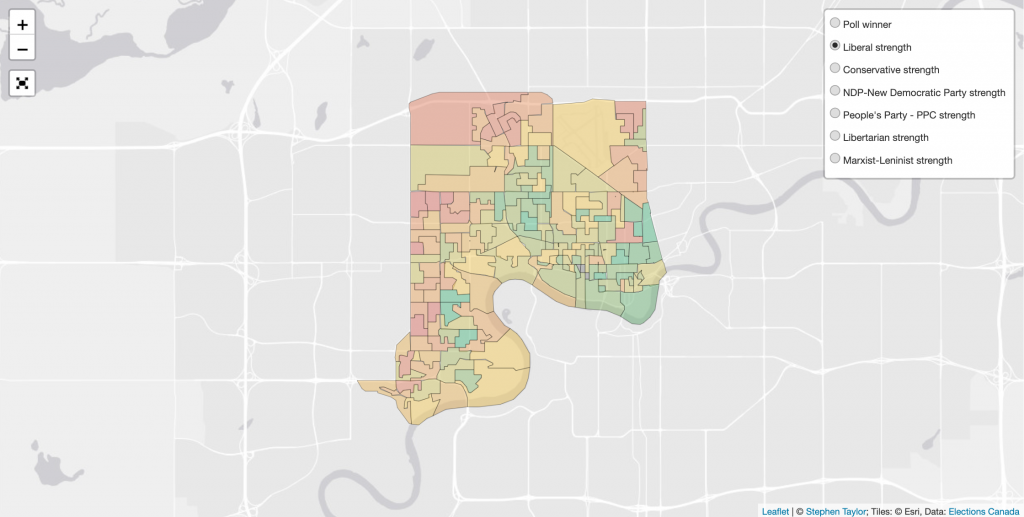
Edmonton Centre votes in 2021. Liberal strength is plotted from green (strong) to red (weak) polls.
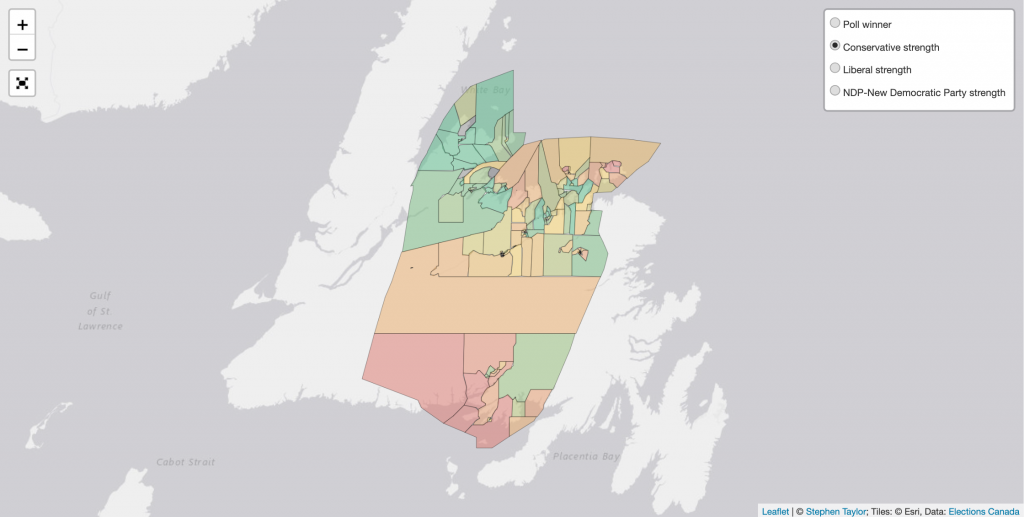
Coast of Bays–Central–Notre Dame was a pickup for the Conservatives in 2021. Scott Simms, the Liberal incumbent was retired after 17 years in office. Conservative strength plotted from green (strong) to red (weak).

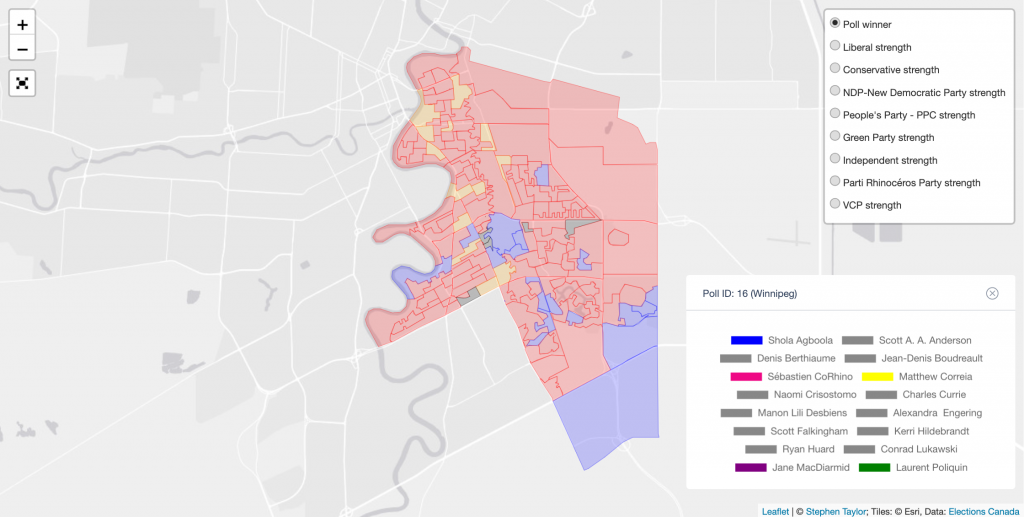
There were some peculiarities of note. Take Saint Boniface–Saint Vital in Manitoba, for example. I believe they have the distinction of running the most candidates for office in 2021.

Democracy scenesters or an inside joke?

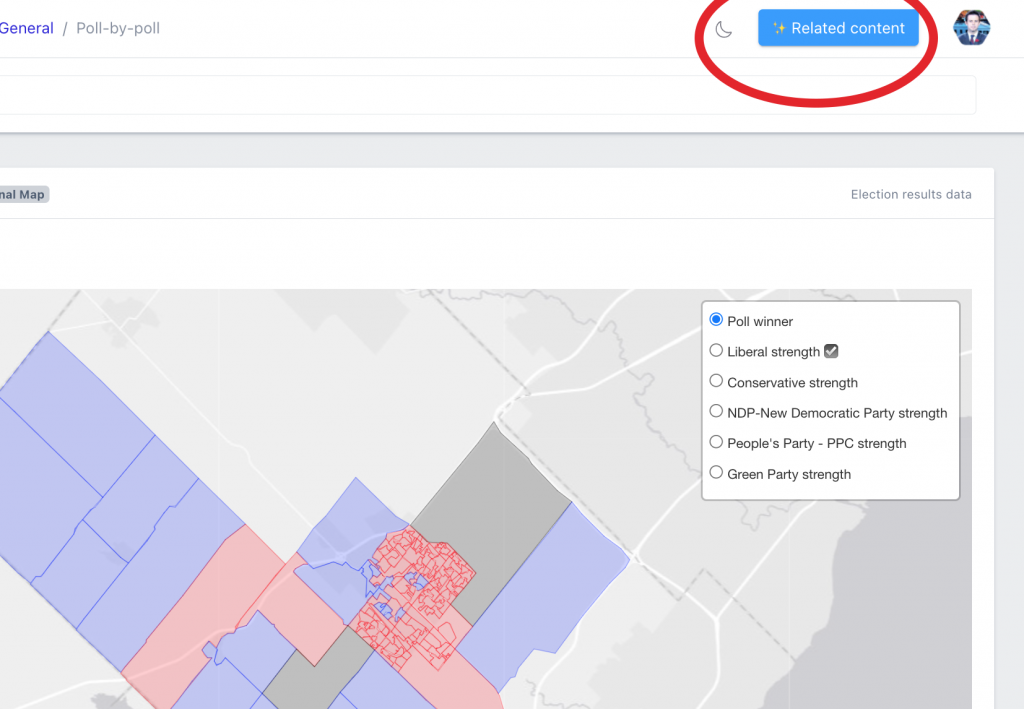
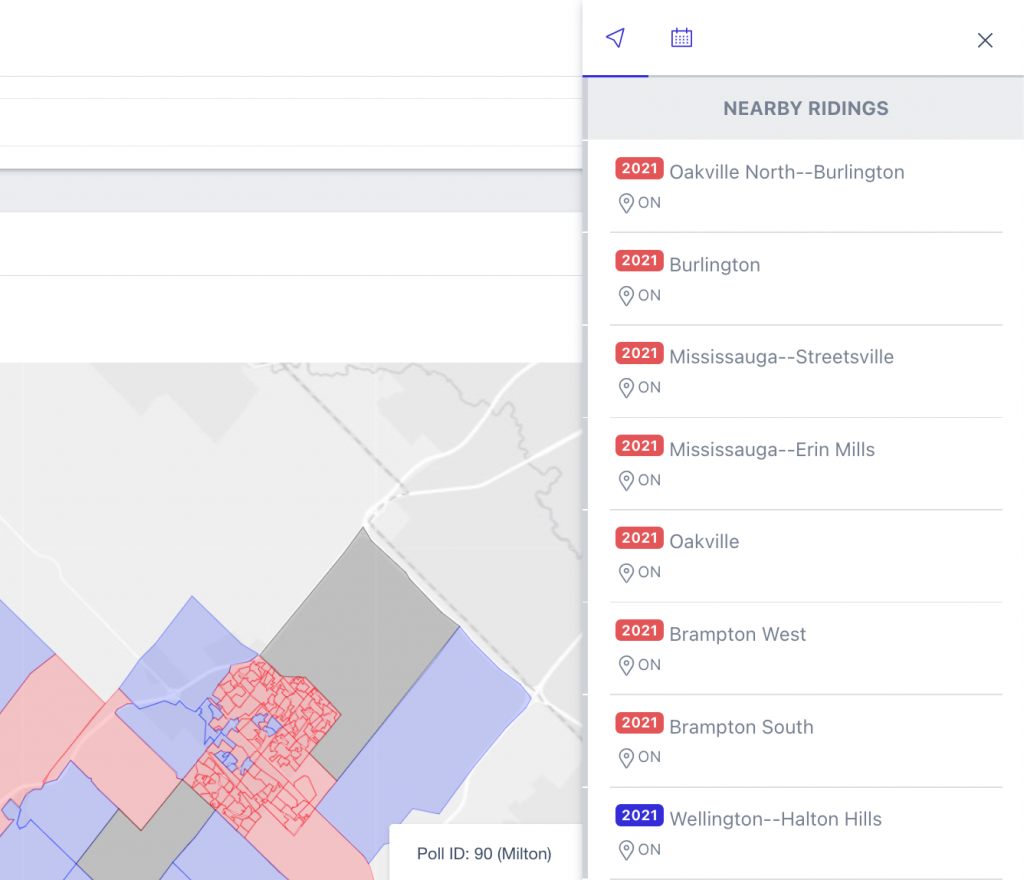
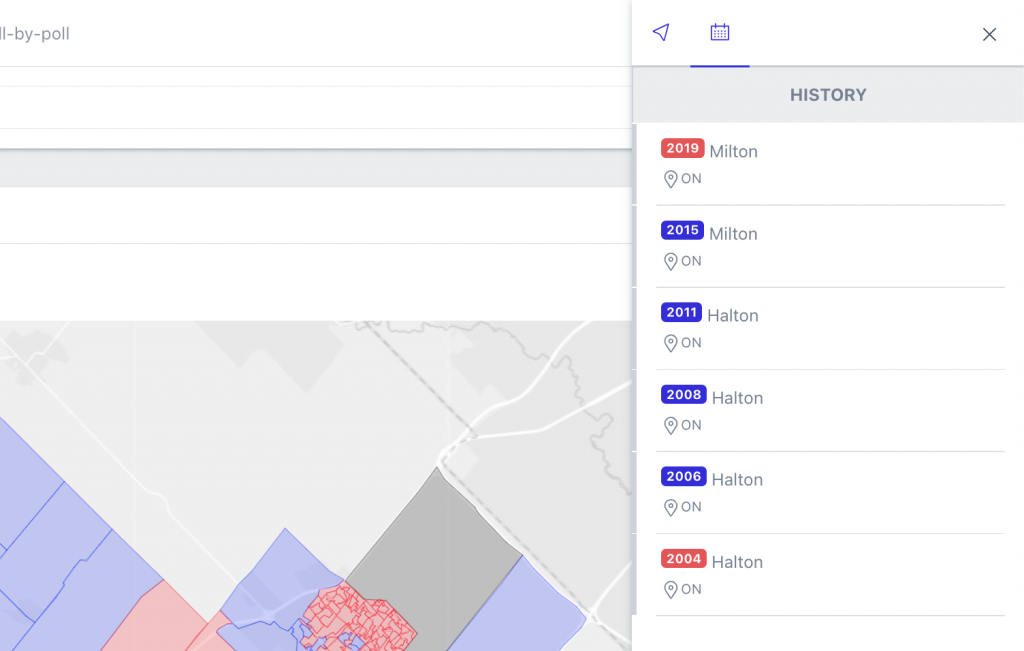
Since the last election, I’ve added a couple of features that make the mapping tool more interactive. You can search for riding in the search bar above any map. Clicking the “✨ Related content” button at the top right of the screen will show you ridings near the local map you’re looking at, and you can also view the history of the riding at a glance and navigate through last 8 elections. Even if the riding didn’t exist during a previous election, those nearest to the current mapped view will show up along the timeline.

Cliiiick ittt….
Get that context!
The history of the Milton riding!

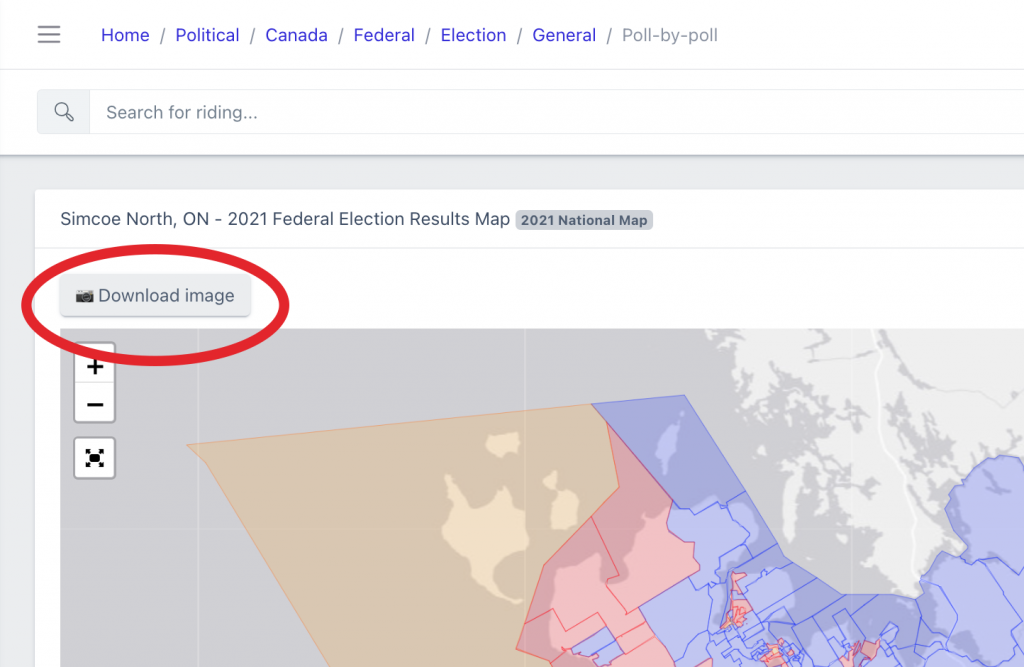
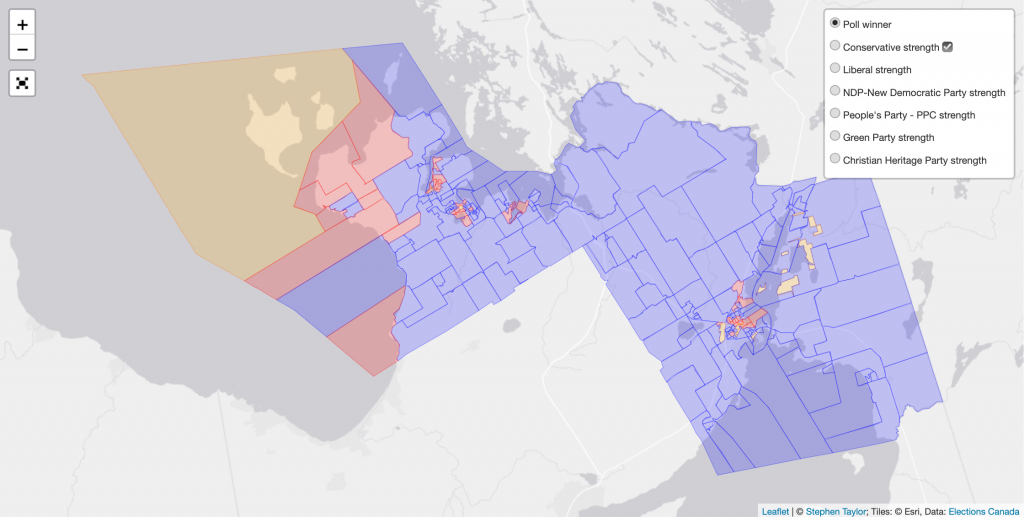
As always, you can size up a map how you like it and click the download image button. Share these maps on Twitter and Instagram. Print them on a t-shirt and wear them proudly to your next family reunion. You’ll be glad you did!

You’ll be the coolest person on twitter when you download these maps to share.
Simcoe North has never looked so good!

I hope you enjoy this project as much I as enjoyed making it. If you have any feature requests, just let me know on twitter @stephen_taylor.

If you want to use the maps on your website, I’d appreciate a link back to my site so that more people can discover the project.

Thanks, and happy exploring!

Related:

The Stephen Taylor Data Project

CPC leadership race mapped out. Where will 2022’s hopefuls look to dominate membership sales?

Original mapping project announcement

We need exit polling for Canadian elections

On October 21st, Justin Trudeau was reduced to minority government status with stronger Conservative opposition forming dominant regional representation in the west and a resurgent Bloc Quebecois spoiling the night for federalist parties in Quebec. Yet, despite this black eye for Trudeau, much of the focus has been on Andrew Scheer’s campaign. Why did he come up short? What held him back? Why could this new opposition leader not do something unprecedented in Canadian history and unseat a one-term majority Prime Minister on his first outing?

Was it Mr. Scheer’s social conservatism? Was it the well-worn Liberal narrative in Ontario that Doug Ford’s “cuts” would be a template for a federal Conservative government? Was it climate change? Many theories abound among jaw-wagging pundits angling for clicks and among Liberals looking to introduce discord into the Conservative party. But why is there such a cottage industry of political know-it-alls offering up theories?

We lack useful data when it comes to why people vote the way they do in Canadian elections.

American context

In the United States, exit polls are conducted the day of the election as voters leave the polls. They are asked who they voted for and why they voted as they did. Their demographics, districts, and psychographics are jotted down and they are asked the kind of questions we are only speculating about in Canada today.

American pundits and commentators are able to appreciate why women in Wisconsin rejected one candidate, while college educated men in Colorado supported another. Depending on the depth of the survey, illuminating results can be derived that can have a real impact on representation and outreach.

So, why don’t we do exit polling in Canadian elections?

It mostly comes down to cost. Pollsters typically take 1000 person samples for their polls on the best of days. This sample is distributed across the country. A person’s reasons for voting Liberal may differ significantly in one part of the country and among one demographic than it may among others in another part of the country. These divisions raise the margin of error among an already small sample. Nik Nanos has an alternative approach where he queries a rolling sample of a few hundred people per day and then pools the result.

Pollsters are already preoccupied with making the best showing as confirmed by the actual electoral result. Exit polls, by contrast, do not have a comparative check on accuracy and therefore don’t award reputational kudos.

Yet, this missing data creates a huge blindspot and hurts our ability to understand the result. Currently, we add up the seats and speculate from there.

Better understanding leads to better representation

Furthermore, it is important to appreciate late-breaking issues that were determining factors in why electors cast their ballot. Vote-switching is also a phenomenon not well-quantified in Canada one that becomes more and more important as Canadians vote strategically in a fractured multi-party system that elects a candidate under first-past-the-post.

Of course, it is illegal to broadcast or disseminate an election survey during the blackout period defined by Canada’s elections regulator. Most importantly, this includes election day itself.

No person shall cause to be transmitted to the public, in an electoral district on polling day before the close of all of the polling stations in that electoral district, the results of an election survey that have not previously been transmitted to the public. 

Canada Elections Act

However, polling can be conducted with the results held until the polls close. Canadian elections and exit polling – it’s long overdue.

So, what halted Andrew Scheer’s victory in Ontario? In Quebec? For that matter, why did Singh lose his caucus in Quebec? Why did Trudeau lose his majority? Without exit polling, we are left to rely on speculation and hot air from pundits.