Fact-checking Canwest’s Don Martin

Yesterday in the National Post, Don Martin wrote a column condemning the Conservative’s “definition” ads on Michael Ignatieff trying to find scandal where there is none.

The Conservative Web site attacking the new Liberal leader is www.Ignatieff. me. Here endeth the federal party’s free publicity.

The .me Internet domain name is registered to the tiny European country of Montenegro, incidentally governed by a coalition, and its Web administrator is based in Arizona. It is, I’m told by experienced Web surfers, often used to showcase pornography.

Columnists and (more unfortunately) reporters often use terms such as “critics say”, “experts agree”, “some suggest” in place of “in my opinion”, “I think”, and “according to me”. Perhaps “I’m told by experienced Web surfers” could be “the Liberal party told me that” but “questions surround” Don’s true source on top level domains and pornography.

I decided that I’d get to the bottom of this. I decided to check Google for the number of sites that came up when one searches for the term “porn”. If Mr. Martin is correct, we’ll see the Montenegro top level domain (TLD) populated with teh porn results. However, I wanted to take a look to be sure.

There are 251 top level domains that I checked (including the 180 or so countries recognized at the UN), the semi-autonomous regions and the other TLDs including .com, .org, .net.

Don’t worry, I didn’t do these searches one at a time, one browser-based Google search after another; I wrote a script that used the Google AJAX API to get the results and crunch them.

For a quick tutorial on google searches, a search for

site:.fr fromage

will return all sites with the keyword “fromage” in the French top level domain.

Using the Google AJAX API, I decided to check every country code for the number of results with the keyword “porn”.

http://ajax.googleapis.com/ajax/services/search/web?v=1.0&q=site:.me%20porn
where “%20” is the URL encoded character for a space

I wrote a PHP script that checks each TLD for “porn” and then parses the results to extract the number of search results from the output of the Google AJAX API call.

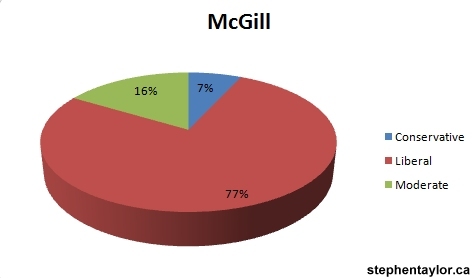
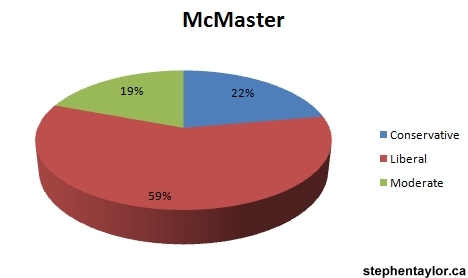
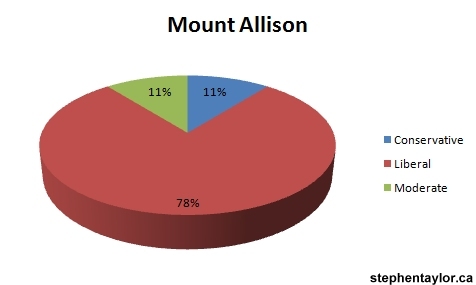
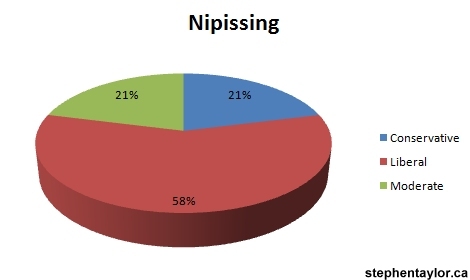
Here are the results (you’ll want to click each graph to enlarge them)

If you click on the image to enlarge it, you’ll see that the most populated TLD for the word “porn” (as indexed by Google) is .com. In fact, Montenegro ranks at 61 for propensity of porn. In fact, if you’d be more likely to find porn on the (.cx) domain for… yes, Christmas Island. If we want to measure the proportion of porn sites in a TLD, .me is 15th behind the “porn-showcasing” countries of the Bahamas, Norfolk Island, Azerbaijan, Grenada, Zimbabwe, Malawi, Western Samoa, Bhutan, Congo, Togo, Tokelau, Georgia, Seychelles Islands, and the Virgin Islands. Just over 1% of .com domain names contain the keyword “porn”. Montenegro clocks in at just half a percent more. So, I think we can put Don Martin’s irresponsible words to rest. In terms of “showcased porn”, you’re much more likely to see it on German, Polish and Russian servers. Further, the term “showcase” is deceiving as well since most domains are open to registration to all local residents (if not all global residents) and there is generally no stipulation that states that a registrant must feature pornography.

But where did Don Martin’s assumption come from? Given the Liberal Party’s embarrassment and lack of foresight in launching a campaign at onprobation.ca when onprobation.com turned out to be a hardcore pornographic website, perhaps the Liberals were floating some bogus talking points over to Martin to get them published as fact.

Now that we’ve resolved the Montenegro issue, and now that we have a great program that sorts TLDs by search terms, let’s make sure that we’re still #1 for what matters (even though all Canadian team have been eliminated).

Take that, Sweden.

If you’re interested in the PHP program, here’s the source code.

govtweets update

Both govtweets.com and govtweets.ca are humming along nicely as the websites track the real-time online conversation via twitter on the POTUS race and the Canadian federal election. Here are some stats I just compiled from the levels of activity on the both govtweets.ca and govtweets.com:

In the past 8 days on govtweets.ca, there have been 303 tweets about Stephen Harper, and 120 about Jack Layton and 92 about Stephane Dion.

Comparatively, in the last 8 days at govtweets.com, there have been 24838 tweets about “Palin”, 22869 tweets about “Obama”, 20671 tweets about “McCain” and 4051 about “Biden”.

Conclusions that we can draw from this are that McCain’s pick of Sarah Palin for VP has generated much more chatter than Obama’s pick Joe Biden. Further, we can see that American politics is much more discussed globally than Canadian politics. But, I think we can also conclude that Canadians are still in the early stages of posting tweets.

And… for those of you who are wondering, I’ll be adding Elizabeth May to govtweets.ca soon.

Facebook statistics

Everybody and their brother knows about Facebook these days. Whether finding old high school classmates, building one’s professional network, or sharing photos among friends, Facebook has many uses to millions of users. There’s a new feature on the website for advertisers that allows the ad buyer the ability of progressively narrowing down a target audience by selecting and excluding demographic data. The side benefit of this is that we can parse Facebook’s user data and get a better understanding of its audience and reach.

Here are the top countries represented on Facebook (users):
1. United States 19,951,900
2. Canada 7,361,720
3. United Kingdom 6,407,580
4. Australia 1,498,320
5. South Africa 605,820
6. France 429,540
7. Norway 891,480
8. Sweden 827,940
9. Mexico 393,940
10. Egypt 376,480
11. Columbia 359,220
12. Turkey 327,760
13. India 287,500
14. Germany 259,760
15. New Zealand 208,000
16. United Arab Emirates 188,600
17. Singapore 180,660
18. Spain 178,900
19. Lebanon 163,720
20. Ireland 131,660
21. Italy 121,000
22. Saudi Arabia 115,980
23. Pakistan 115,240
24. Netherlands 109,840
25. Switzerland 99,600
26. Malaysia 98,060
27. Japan 95,340
28. Israel 94,180
29. China 83,640
30. South Korea 51,080
31. Dominican Republic 33,060

In Canada, the male/female breakdown is:
2,507,620 male
3,431,280 female

The top cities in Canada are:
1,326,280 Toronto
549,600 Montreal
346,020 Vancouver
317,700 Halifax
275,820 Ottawa
186,620 Winnipeg
432,060 Calgary
365,120 Edmonton

In Canada, the political breakdown is:
618,240 Liberal
236,540 Moderate
281,840 Conservative

The male/female breakdown of these figures are (m/f)
282,220/291,300 Liberal
126,360/94,480 Moderate
158,020/104,460 Conservative

As one goes through college/university in Canada, does one become more or less Liberal or Conservative?
Conservative:
Freshmen 3,420
Sophomores 4,300
Juniors 4,440
Seniors 4,760

conservativesovertime.jpg
Click to enlarge

Liberal:
9,740 Fresmen
13,160 Sophomores
14,500 Juniors
16,840 Seniors

liberalsovertime.jpg

Note the slopes on both graphs. The Conservative graph has a slope of y=416x meaning that as each year goes by, with all else being equal, we can infer that the university experience produces 416 more Conservatives each year of school. Likewise, the slope of the Liberal graph is y=2264x meaning that if our assumptions are the same, we can infer that the university experience produces 2264 more Liberals per year of the undergraduate experience. It would be beneficial to measure the data over four years, but we can hypothesize from this data that universities are having the effect of producing Liberals over Conservatives at 4:1 per year.

(Note that these figures are taken for individuals at the current time, a changing trend is only inferred. All we know for sure is there are more partisans/idelogues in both camps in later years of undergraduate.)

Let’s take a look at how politics breaks down at each Canadian university
University Liberal/Moderate/Conservative
Acadia 360/80/60

acadia-graph.jpg
Click to enlarge

Bishop’s 180/40/60

bishops-graph.jpg
Click to enlarge

Brock 1,040/320/420

brock-graph.jpg
Click to enlarge

Carleton 2,340/740/800

carleton-graph.jpg
Click to enlarge

Concordia 1,060/240/120

concordia-graph.jpg
Click to enlarge

Dalhousie 1,280/260/280

dalhousie-graph.jpg
Click to enlarge

Lakehead 360/120/120

lakehead-graph.jpg
Click to enlarge

Laurentian 440/100/100

laurentian-graph.jpg
Click to enlarge

McGill 3,360/720/300

mcgill-graph.jpg
Click to enlarge

McMaster 2,000/660/760

mcmaster-graph.jpg
Click to enlarge

Mount Allison 440/60/60

mounta-graph.jpg
Click to enlarge

Nipissing 220/80/80

nipissing-graph.jpg
Click to enlarge

Queen’s University 2,220/500/600

queensu-graph.jpg
Click to enlarge

Royal Military College 60/60/180

rmc-graph.jpg
Click to enlarge

Ryerson 2,020/560/360

ryerson-graph.jpg
Click to enlarge

St. Francis Xavier 480/100/180

stfx-graph.jpg
Click to enlarge

Simon Fraser University 1,400/440/340

sfu-graph.jpg
Click to enlarge

Trent 800/160/180

trent-graph.jpg
Click to enlarge

University of Alberta 2,340/900/1,340

ualberta-graph.jpg
Click to enlarge

University of British Columbia 3,120/920/620

ubc-graph.jpg
Click to enlarge

University of Calgary 1,220/540/840

ucalgary-graph.jpg
Click to enlarge

University of Guelph 2,060/460/500

uguelph-graph.jpg
Click to enlarge

University of Lethbridge 480/200/440

ulethbridge-graph.jpg
Click to enlarge

University of New Brunswick 800/180/220

unb-graph.jpg
Click to enlarge

University of Ottawa 2,440/640/620

uottawa-graph.jpg
Click to enlarge

U Regina 220/40/80

uregina-graph.jpg
Click to enlarge

University of Saskatchewan 620/200/380

usask-graph.jpg
Click to enlarge

University of Sherbrooke 80/100/20* (* fewer than 20)

usherbrooke-graph.jpg
Click to enlarge

University of Toronto 5,560/1,740/1,140

uoft-graph.jpg
Click to enlarge

University of Victoria 1,300/400/280

uvic-graph.jpg
Click to enlarge

University of Waterloo 2,380/840/680

waterloo-graph.jpg
Click to enlarge

University of Western Ontario 2,820/760/980

uwo-graph.jpg
Click to enlarge

University of Windsor 1,140/280/340

uwindsor-graph.jpg
Click to enlarge

Wilfrid Laurier University 1,540/420/480

wlu-graph.jpg
Click to enlarge

York University 3,520/980/700

york-graph.jpg
Click to enlarge

As for the ratio of Liberal students:Conservative students?
Here are the top five (the most Liberal schools in the country by this measure):
McGill 11.2:1
Concordia 8.8:1
Mount Allison 7.3:1
Acadia 6:1
Ryerson 5.6:1

And the bottom five (the most Conservative schools in the country by this measure):
Royal Military College 0.33:1
University of Lethbridge 1.1:1
University of Calgary 1.5:1
University of Saskatchewan 1.6:1
University of Alberta 1.7:1

A bit more about the methodology:
This data was taken from this Facebook page on October 17th, 2007. All data is self-declared by individuals with Facebook profiles.

UPDATE: It appears that Facebook has disabled the feature.