Here’s something that should give every political nerd hours of material to pore over. The Stephen Taylor Data Project is releasing some political maps, graphs, and census data for your consumption during this latest Canadian general election.
This efforts is the culmination of months of spare-time effort to package historical election results in an easy-to-digest format for Canadians during this 44th general election. You can browse every general election from 2019 back through the year 2000 (7 elections) and look at historical trends on each, with every riding map broken down by polling division.
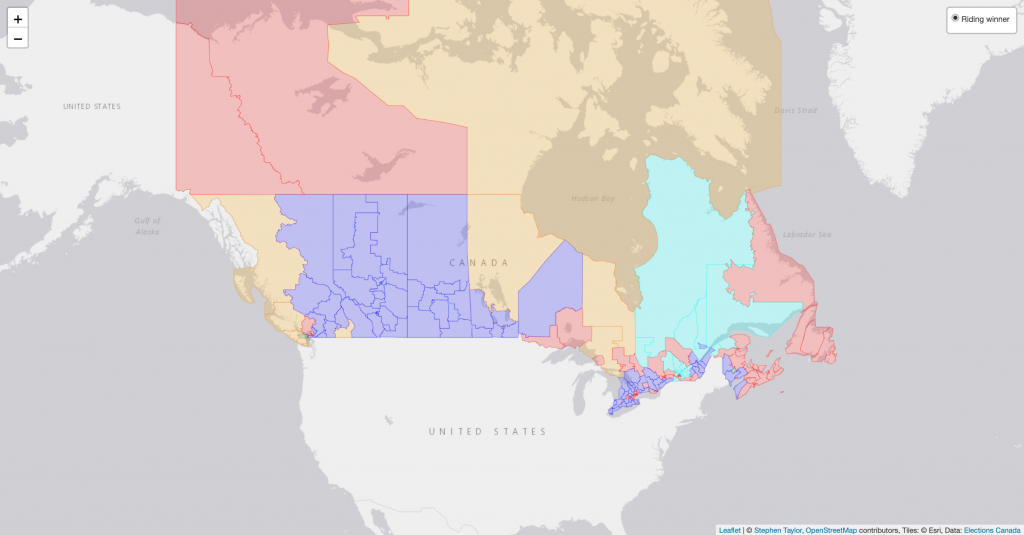
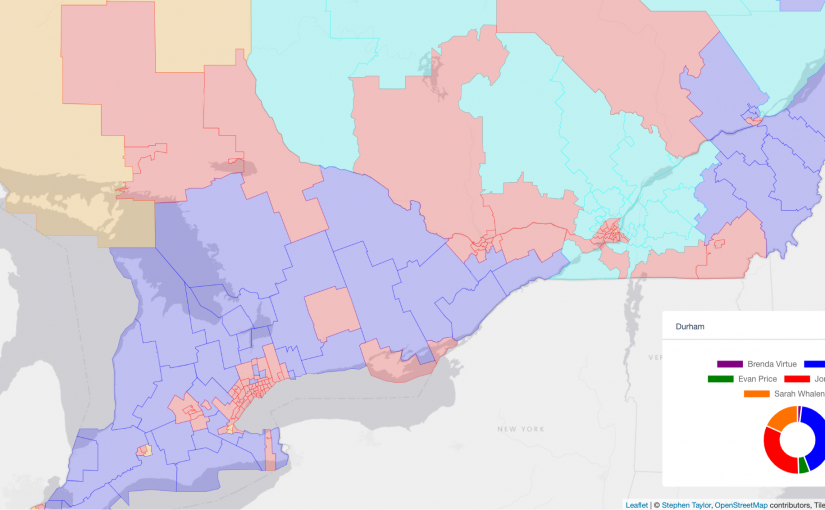
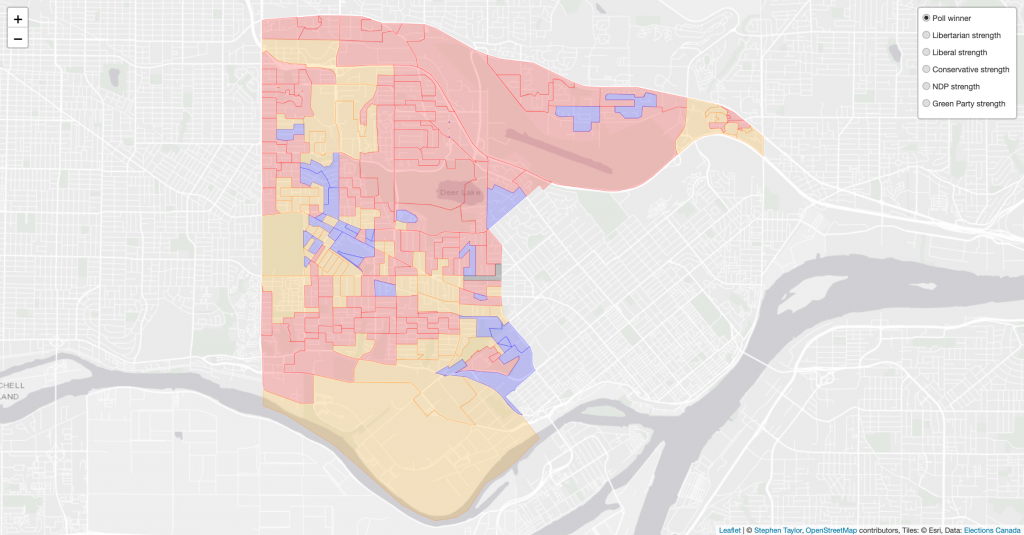
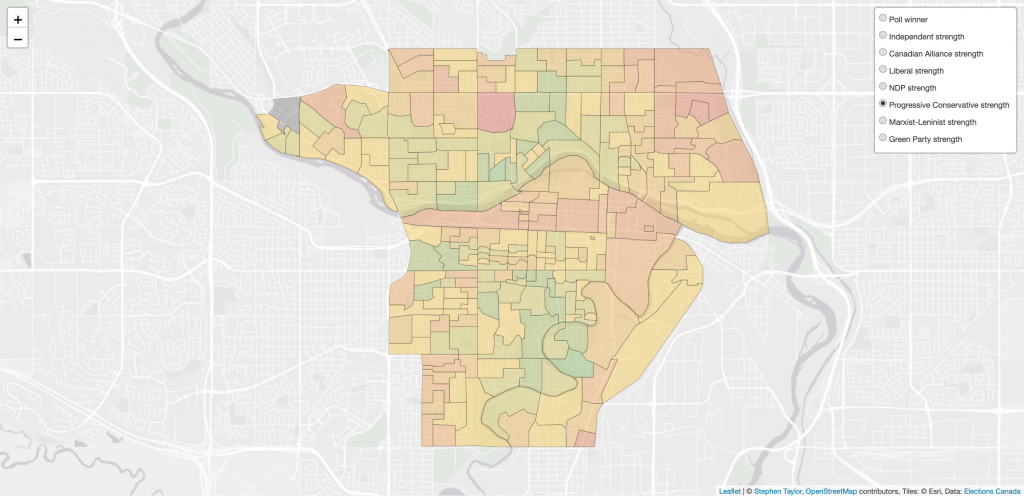
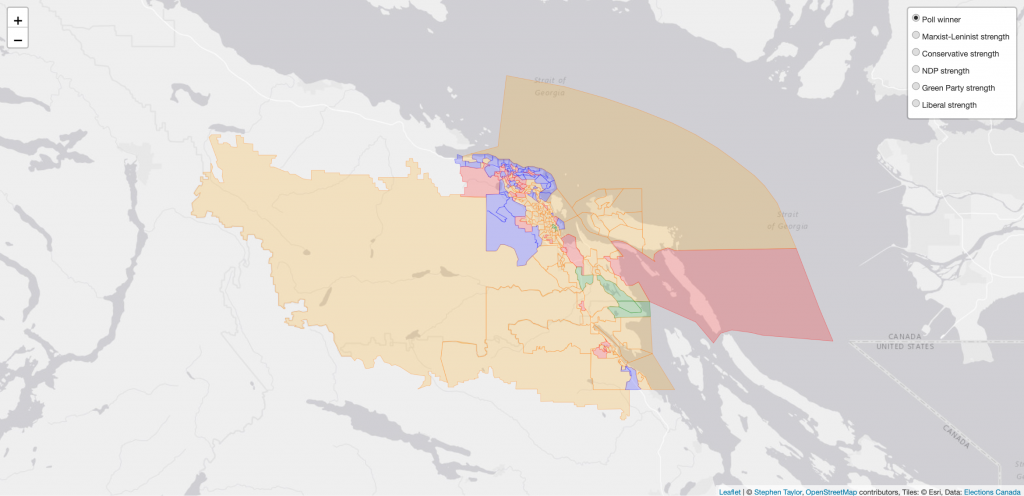
Furthermore, you can create maps of each riding based on the relative strength of the party in each poll of each riding
If you’ve ever wanted to understand Liberal voting patterns, appreciate Conservative strongholds on a granular level, be facinated by the NDP’s local strategy, or track the Green Party’s and Bloc’s ebbs and flows, now you can! We’ve even got Alliance and PC results from the days of yore to bookend a re-emerging trend of some vote-splitting on the right that began again in 2019.
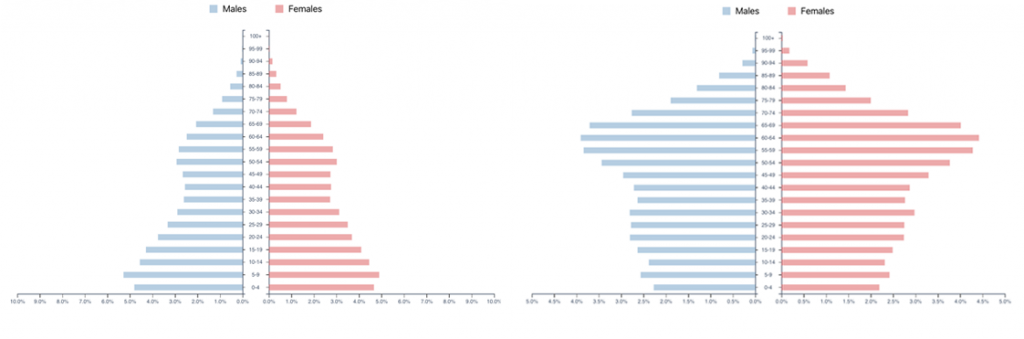
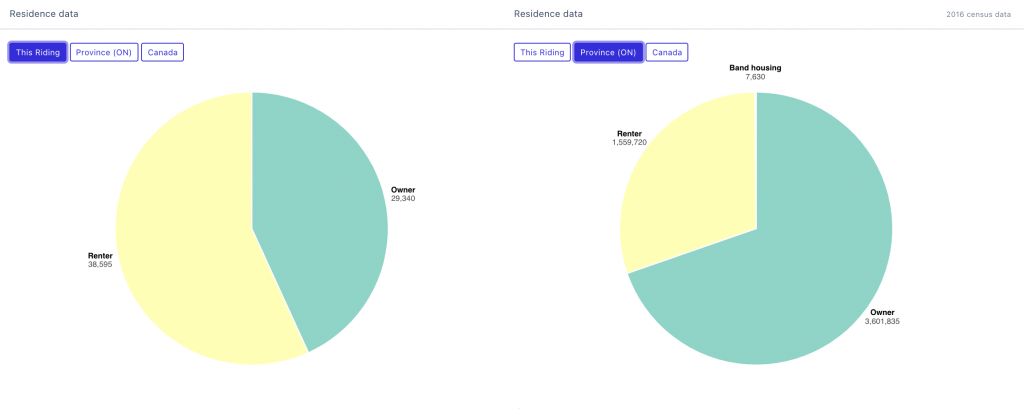
I’ve also combined data from the last census – perfectly segmented by riding – to give insights on what motivates voters. For example, income and affordability are top-of-mind issues for a lot of Canadians during this election. This project helps you consider these factors in each riding and compare these trends both nationally and provincially.
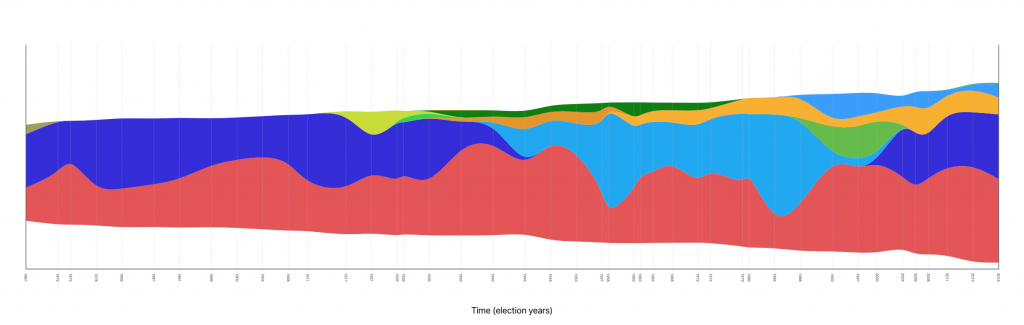
I’ve also put up historical polling data that you can browse and I have a visualization demonstrating the rise, fall, and sustained dominance of Canada’s various political parties, as elected by voters to Canada’s federal Parliament.
You can take a snapshot of each map by clicking the camera icon 📷 at the top of each geographic visualization. The images I’ve shared in this post were created this way. Go ahead and take snapshots of your favourite ridings (and favourite elections!) and share these images on social media. If you’re writing for a news outlet and you find any of this useful, please link to this post and to the Stephen Taylor Data Project! If you’re an avid twitter user, please tweet about this project.
So, please take a look and I hope that you enjoy! This work is being made available to general public and to every partisan of every party. I believe very strongly in a more representative democracy and believe that when more data becomes available and accessible that describes the shape of the Canadian vote, the more responsive our candidates can be in meeting that representation.
The project was coded using ReactJS, using both NoSQL (MongoDB) and relational (MySQL) databases to serve data through a common GraphQL layer facilitated by Apollo client on a Node.js server. Four gigabytes of GeoJSON files were constructed locally using some more of that server-side javascript magic. Those files are served via AWS S3, and are visualized for the end-user using the Leaflet library. Infographics SVGs are assembled using D3JS.